Integrating PostgreSQL Part 7: Management Tools for Monitoring, Alerting, and Tuning
Next up in our Integrating PostgreSQL blog series, we'll further explore PostgreSQL integration to help enterprises do more and go faster.
This blog post will highlight the next area of importance: Management Tools for Monitoring, Alerting, and Tuning.

Database server monitoring includes the following layers:
- Operating system and hardware - Tracks areas like input, output, memory utilization, network utilization, CPU, physical disk space, and component status.
- PostgreSQL server - Examines DML and DDL statements in logs, wait time, users, objects, whether backups ran successfully, and whether replication is running.
- Query performance - Analyzes individual SQL statements or queries, to examine throughput, latency, concurrency/load, and how errors are being dealt with.
Monitoring Tool Results
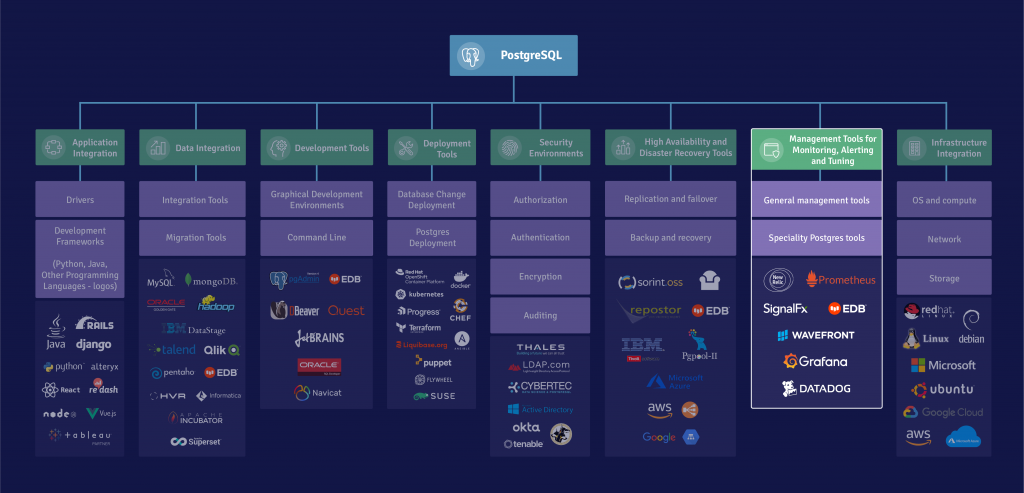
Several general-purpose monitoring tools, like Datadog, Wavefront, SignalFX, and Prometheus with Grafana, are often used to monitor servers running PostgreSQL. Prometheus and Grafana are especially popular in containerized environments.
A 2020 survey of 3,000 PostgreSQL visitors to the EDB website showed that Datadog, PGObserver, NewRelic and Prometheus are popular choices for users who do not choose EDB Postgres Enterprise Manager.
Specialty tools, such as EDB’s Postgres Enterprise Manager®, are focused on PostgreSQL and collect specialized data sets and perform PostgreSQL-specific analytics to allow DBAs to get the most value out of PostgreSQL.
Stay tuned for the next post in this series, which will cover Infrastructure Integration. In the meantime, check out our infographic to see the bigger picture in regard to PostgreSQL integration.
