A couple years ago (at the pgconf.eu 2014 in Madrid) I presented a talk called “Performance Archaeology” which showed how performance changed in recent PostgreSQL releases. I did that talk as I think the long-term view is interesting and may give us insights that may be very valuable. For people who actually work on PostgreSQL code like me, it’s a useful guide for future development, and for PostgreSQL users it may help with evaluating upgrades.
So I’ve decided to repeat this exercise, and write a couple blog posts analyzing performance for a number of PostgreSQL versions. In the 2014 talk I started with PostgreSQL 7.4, which at that point was about 10 years old (released in 2003). This time I’ll start with PostgreSQL 8.3, which is about 12 years old.
Why not start with PostgreSQL 7.4 again? There are about three main reasons why I decided to start with PostgreSQL 8.3. Firstly, general laziness. The older the version, the harder it may be to build using current compiler versions etc. Secondly, it takes time to run proper benchmarks especially with larger amounts of data, so adding a single major version may easily add a couple days of machine time. It just didn’t seem worth it. And finally, 8.3 introduced a number of important changes – autovacuum improvements (enabled by default, concurrent worker processes, …), full-text search integrated into core, spread checkpoints, and so on. So I think it makes perfect sense to start with PostgreSQL 8.3. Which was released about 12 years ago, so this comparison will actually cover a longer period of time.
I’ve decided to benchmark three basic workload types – OLTP, analytics and full-text search. I think the OLTP and analytics are fairly obvious choices, as most applications are some mix of those two basic types. The full-text search allows me to demonstrate improvements in special types of indexes, which are also used to index popular data types like JSONB, types used by PostGIS etc.
Why do this at all?
Is it actually worth the effort? After all, we do benchmarks during development all the time to show that a patch helps and/or that it does not cause regressions, right? The trouble is these are usually only “partial” benchmarks, comparing two particular commits, and usually with a fairly limited selection of workloads that we think may be relevant. Which makes perfect sense – you simply can’t run a full battery of workloads for each commit.
Once in a while (usually shortly after a release of a new PostgreSQL major version) people run tests comparing the new version to the preceding one, which is nice and I encourage you to run such benchmarks (be it some sort of standard benchmark, or something specific to your application). But it’s hard to combine these results into a longer-term view, because those tests use different configurations and hardware (usually a more recent one for the newer version), and so on. So it’s hard to make clear judgments about changes in general.
The same applies to application performance, which is the “ultimate benchmark” of course. But people may not upgrade to every major version (sometimes they may skip a couple of versions, e.g. from 9.5 to 12). And when they upgrade, it’s often combined with hardware upgrades etc. Not to mention that applications evolve over time (new features, additional complexity), the amounts of data and number of concurrent users grow, etc.
That’s what this blog series tries to show – long-term trends in PostgreSQL performance for some basic workloads, so that we – the developers – get some warm and fuzzy feeling about the good work over the years. And to show to users that even though PostgreSQL is a mature product at this point, there still are significant improvements in every new major version.
It is not my goal to use these benchmarks for comparison with other database products, or producing results to meet any official ranking (like the TPC-H one). My goal is simply to educate myself as a PostgreSQL developer, maybe identify and investigate some problems, and share the findings with others.
Fair comparison?
I don’t think any such comparisons of versions released over 12 years can’t be entirely fair, because any software is developed in a particular context – hardware is a good example, for a database system. If you look at the machines you used 12 years ago, how many cores did they have, how much RAM? What type of storage did they use?
A typical midrange server in 2008 had maybe 8-12 cores, 16GB of RAM, and a RAID with a couple of SAS drives. A typical midrange server today might have a couple dozens of cores, hundreds of GB of RAM, and SSD storage.
Software development is organized by priority – there’s always more potential tasks than you have time for, so you need to pick tasks with the best cost/benefit ratio for your users (especially those funding the project, directly or indirectly). And in 2008 some optimizations probably were not relevant yet – most machines did not have extreme amounts of RAM so optimizing for large shared buffers was not worth it yet, for example. And a lot of the CPU bottlenecks were outshadowed by I/O, because most machines had “spinning rust” storage.
Note: Of course, there were customers using pretty large machines even back then. Some used community Postgres with various tweaks, others decided to run with one of the various Postgres forks with additional capabilities (e.g. massive parallelism, distributed queries, using FPGA etc.). And this did influence the community development too, of course.
As the larger machines became more common over the years, more people could afford machines with large amounts of RAM and high core counts, shifting the cost/benefit ratio. The bottlenecks got investigated and addressed, allowing newer versions to perform better.
This means a benchmark like this is always a bit unfair – it will favor either the older or newer version, depending on the setup (hardware, config). I have tried to pick hardware and config parameters so that it’s not too bad for older versions, though.
The point I’m trying to make is that this does not mean the older PostgreSQL versions were crap – this is how software development works. You address the bottlenecks your users are likely to encounter, not the bottlenecks they might encounter in 10 years.
Hardware
I prefer to do benchmarks on physical hardware I have direct access to, because that allows me to control all the details, I have access to all the details, and so on. So I’ve used the machine I have in our office – nothing fancy, but hopefully good enough for this purpose.
- 2x E5-2620 v4 (16 cores, 32 threads)
- 64GB RAM
- Intel Optane 900P 280GB NVMe SSD (data)
- 3 x 7.2k SATA RAID0 (temporary tablespace)
- kernel 5.6.15, ext4
- gcc 9.2.0, clang 9.0.1
I have also used a second – much smaller – machine, with only 4 cores and 8GB of RAM, which generally shows the same improvements / regressions, just less pronounced.
pgbench
As a benchmarking tool I’ve used the well-known pgbench, using the newest version (from PostgreSQL 13) to test all versions. This eliminates possible bias due to optimizations done in pgbench over time, making the results more comparable.
The benchmark tests a number of different cases, varying a number of parameters, namely:
scale
- small – data fits into shared buffers, showing locking issues etc.
- medium – data larger than shared buffers but fits into RAM, usually CPU bound (or possibly I/O for read-write workloads)
- large – data larger than RAM, primarily I/O bound
modes
- read-only – pgbench -S
- read-write – pgbench -N
client counts
- 1, 4, 8, 16, 32, 64, 128, 256
- the number of pgbench threads (-j) is tweaked accordingly
Results
OK, let’s look at the results. I’ll present results from the NVMe storage first, then I’ll show some interesting results using the SATA RAID storage.
NVMe SSD / read-only
For the small data set (that fully fits into shared buffers), the read-only results look like this:
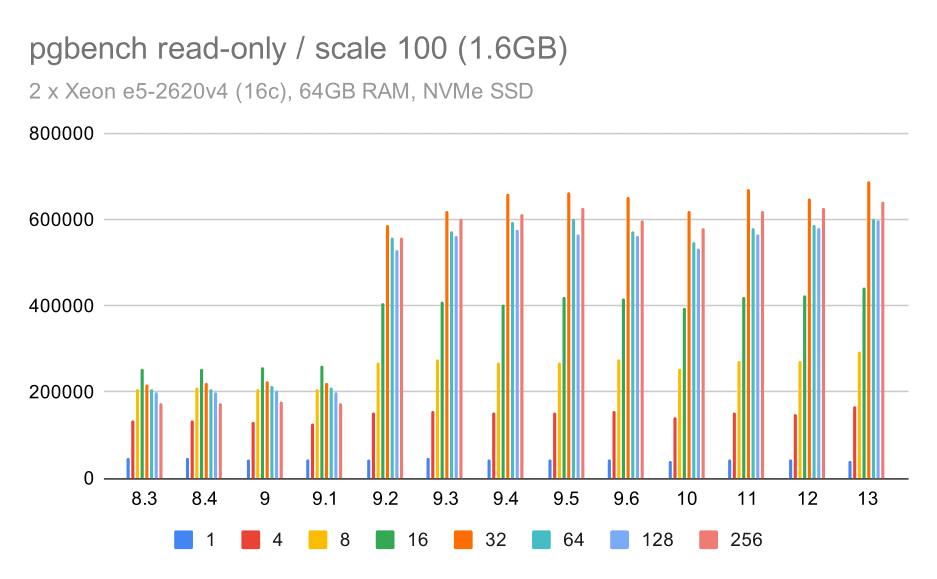
pgbench results / read-only on small data set (scale 100, i.e. 1.6GB)
Clearly, there was a significant increase of throughput in 9.2, which contained a number of performance improvements, for example fast-path for locking. The throughput for a single client actually drops a bit – from 47k tps to only about 42k tps. But for higher client counts the improvement in 9.2 is pretty clear.
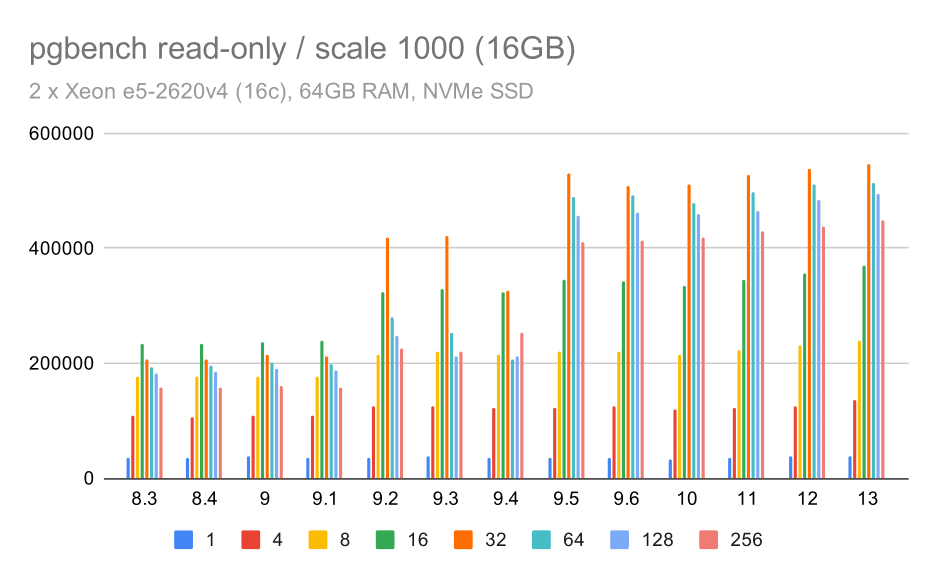
pgbench results / read-only on medium data set (scale 1000, i.e. 16GB)
For the medium data set (which is larger than shared buffers but still fits into RAM) there seems to be some improvement in 9.2 also, although not as clear as above, followed by a much clearer improvement in 9.5 most likely thanks to lock scalability improvements.
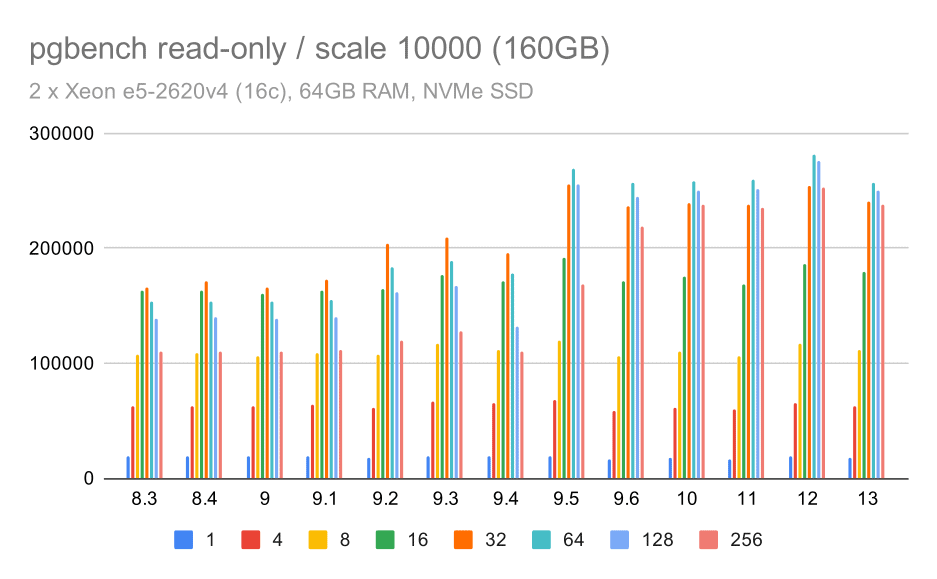
pgbench results / read-only on large data set (scale 10000, i.e. 160GB)
On the largest data set, which is mostly about the ability to efficiently utilize the storage, there is some speedup too – most likely thanks to the 9.5 improvements too.
NVMe SSD / read-write
The read-write results show some improvements too, although not as pronounced. On the small data set, the results look like this:
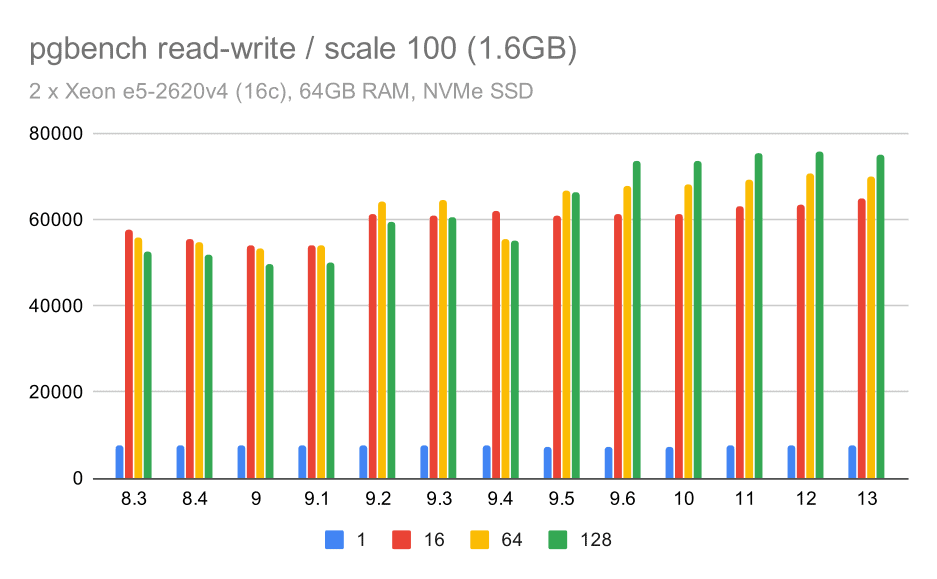
pgbench results / read-write on small data set (scale 100, i.e. 1.6GB)
So a modest improvement from about 52k to 75k tps with sufficient number of clients.
For the medium data set, the improvement is much clearer – from about 27k to 63k tps, i.e. the throughput more than doubles.
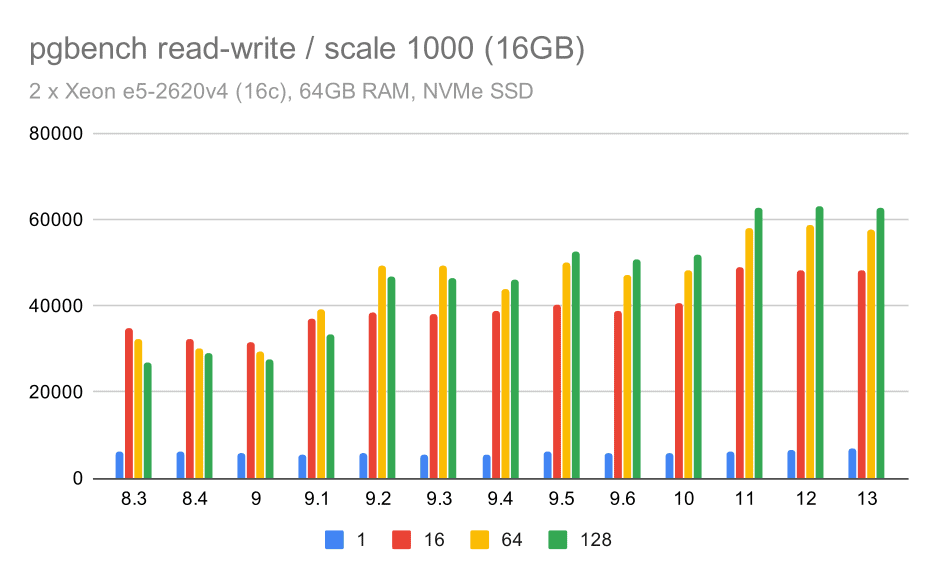
pgbench results / read-write on medium data set (scale 1000, i.e. 16GB)
For the largest data set, we see a similar overall improvement, but there seems to be some regressionbetween 9.5 and 11.
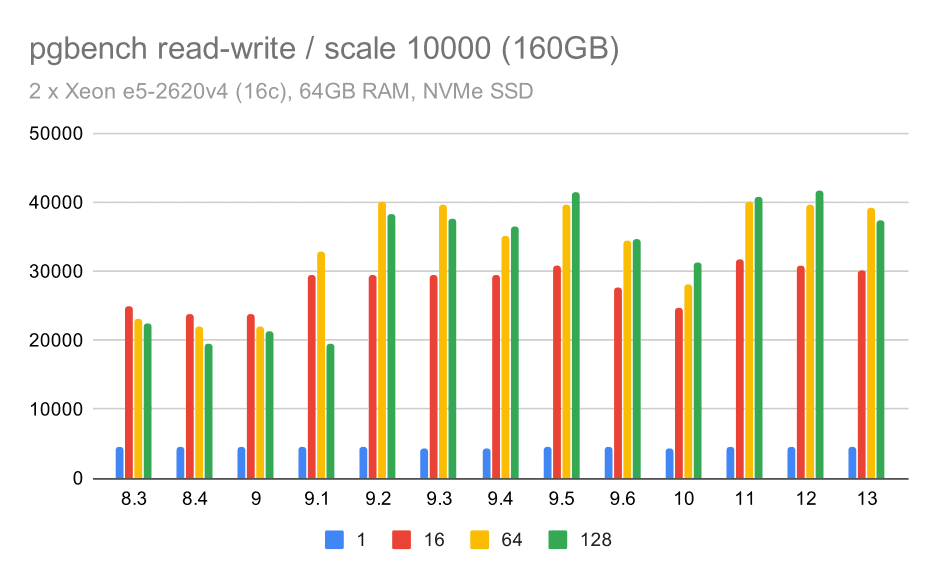
pgbench results / read-write on large data set (scale 10000, i.e. 160GB)
SATA RAID / read-only
For the SATA RAID storage, the read-only results are not that nice. We can ignore the small and medium data sets, for which the storage system is irrelevant. For the large data set, the throughput is somewhat noisy but it seems to actually decrease over time – particularly since PostgreSQL 9.6. I don’t know what is the reason for this (nothing in 9.6 release notes stands out like a clear candidate), but it seems like some sort of regression.
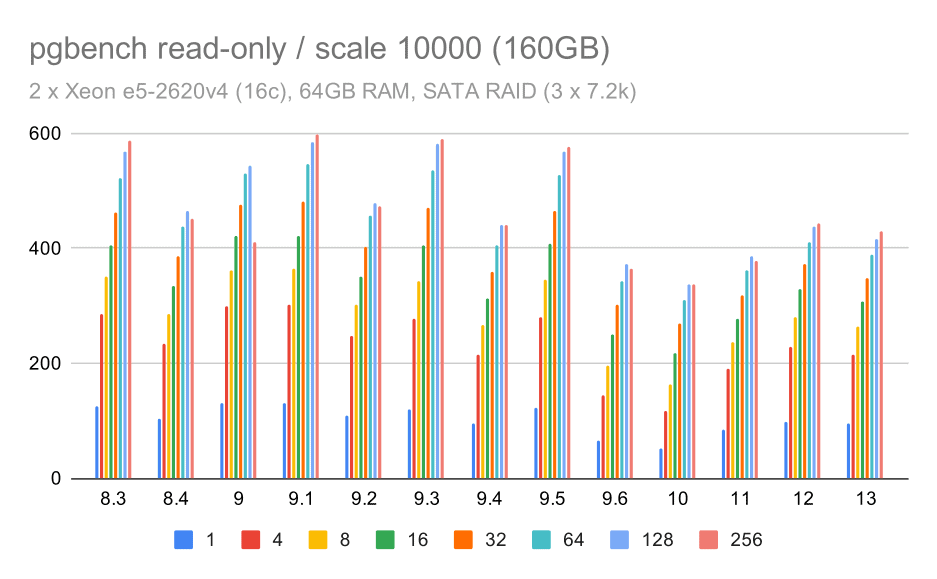
pgbench results on SATA RAID / read-only on large data set (scale 10000, i.e. 160GB)
SATA RAID / read-write
The read-write behavior seems much nicer, though. On the small data set, the throughput increases from about 600 tps to more than 6000 tps. I’d bet this is thanks to improvements to group commit in 9.1 and 9.2.
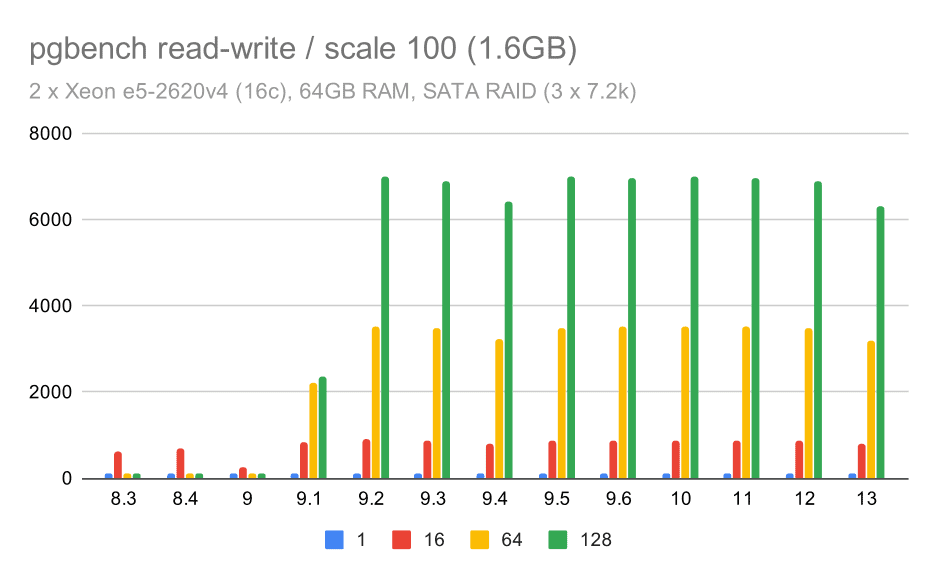
pgbench results on SATA RAID / read-write on small data set (scale 100, i.e. 1.6GB)
For the medium and large scales we can see similar – but smaller – improvement, because the storage also needs to handle the I/O requests to read and write the data blocks. For the medium scale we only need to do the writes (as the data fits into RAM), for the large scale we also need to do the reads – so the maximum throughput is even lower.
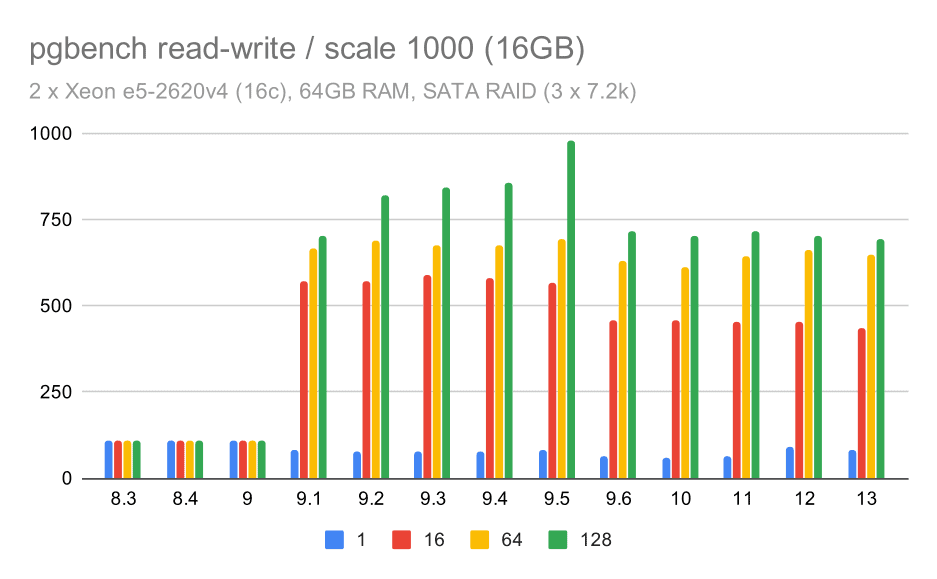
pgbench results on SATA RAID / read-write on medium data set (scale 1000, i.e. 16GB)
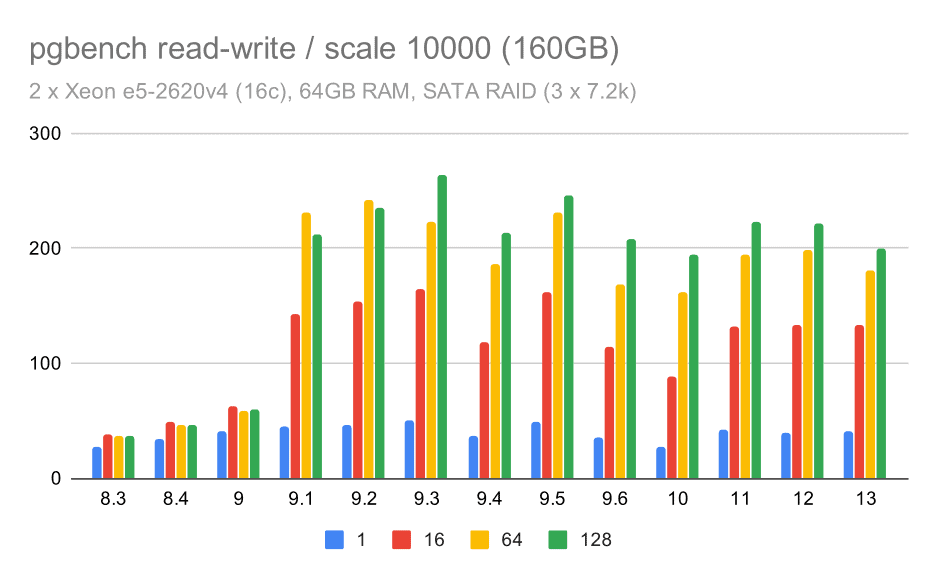
pgbench results on SATA RAID / read-write on large data set (scale 10000, i.e. 160GB)
Summary and Future
To summarize this, for the NVMe setup the conclusions seem to be pretty positive. For the read-only workload there’s a moderate speedup in 9.2 and significant speedup in 9.5, thanks to scalability optimizations, while for the read-write workload the performance improved by about 2x over time, in multiple versions / steps.
With the SATA RAID setup the conclusions are somewhat mixed, though. In case of the read-only workload there’s a lot of variability / noise, and possible regression in 9.6. For the read-write workload, there’s a massive speedup in 9.1 where the throughput suddenly increased from 100 tps to about 600 tps.
What about improvements in future PostgreSQL versions? I don’t have a very clear idea what the next big improvement will be – I’m however sure other PostgreSQL hackers will come up with brilliant ideas that make things more efficient or allow leveraging available hardware resources. The patch to improve scalability with many connections or the patch to add support for non-volatile WAL buffers are examples of such improvements. We might see some radical improvements to PostgreSQL storage (more efficient on-disk format, using direct I/O etc.), indexing, etc.
