Benchmark on a Parallel Processing Monster!
Last year I wrote about a benchmark which I performed on the Parallel Aggregate feature that I worked on for PostgreSQL 9.6. I was pretty excited to see this code finally ship in September last year, however something stood out on the release announcement that I didn’t quite understand:
Scale Up with Parallel Query
Version 9.6 adds support for parallelizing some query operations, enabling utilization of several or all of the cores on a server to return query results faster. This release includes parallel sequential (table) scan, aggregation, and joins. Depending on details and available cores, parallelism can speed up big data queries by as much as 32 times faster.
It was the “as much as 32 times faster” that I was confused at. I saw no reason for this limit. Sure, if you have 32 CPU cores, then that’ll be the limit, but what if you had…. say…. 72 of them?
Luckily I just happened to get access to such a machine, thanks to our friends over at Postgres-Pro.
Hardware
- 4 x E7-8890 v3 CPUs (72 cores, 144 with HT)
- 3TB RAM
- P830i RAID controller (4GB write cache)
- 10x 1.92TB RAID10 12Gbps SAS SSD (VO1920JEUQQ)
- CentOS 7.2.1511 (with kernel 3.10.0-327.13.1.el7)
Benchmark
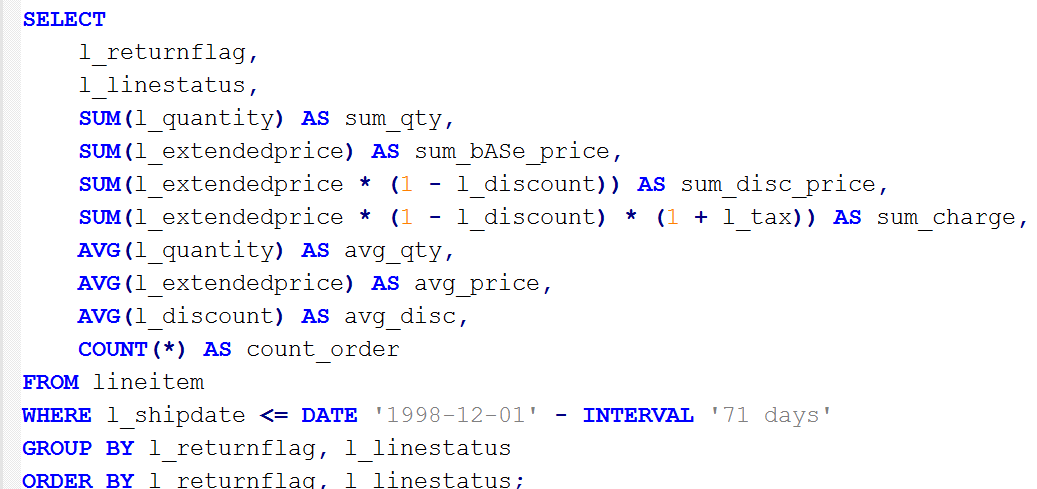
I decided to perform the same TPC-H Query 1 that I had used last year on the 32 core server. This performs some fairly complex aggregation on a single table. My weapon of choice was PostgreSQL 9.6.
I decided to use a dataset 1 TB in size, meaning that there was about 6 billion rows in the “lineitem” table. The output of the query produces only 4 rows, which means the parallel part of the query, in this case a Parallel Seq Scan, followed by a Parallel Partial Aggregate is the vast majority of the work, whereas the sequential part, the Finalize Aggregate and the Sort, are very short, and they only produce 4 rows.
I tested various parallel worker counts by performing:
ALTER TABLE lineitem SET (parallel_workers= <number of parallel worker processes>);
Due to the high number of cores in this server I performed this in increments of 4, after having reached 4 parallel workers.
Results
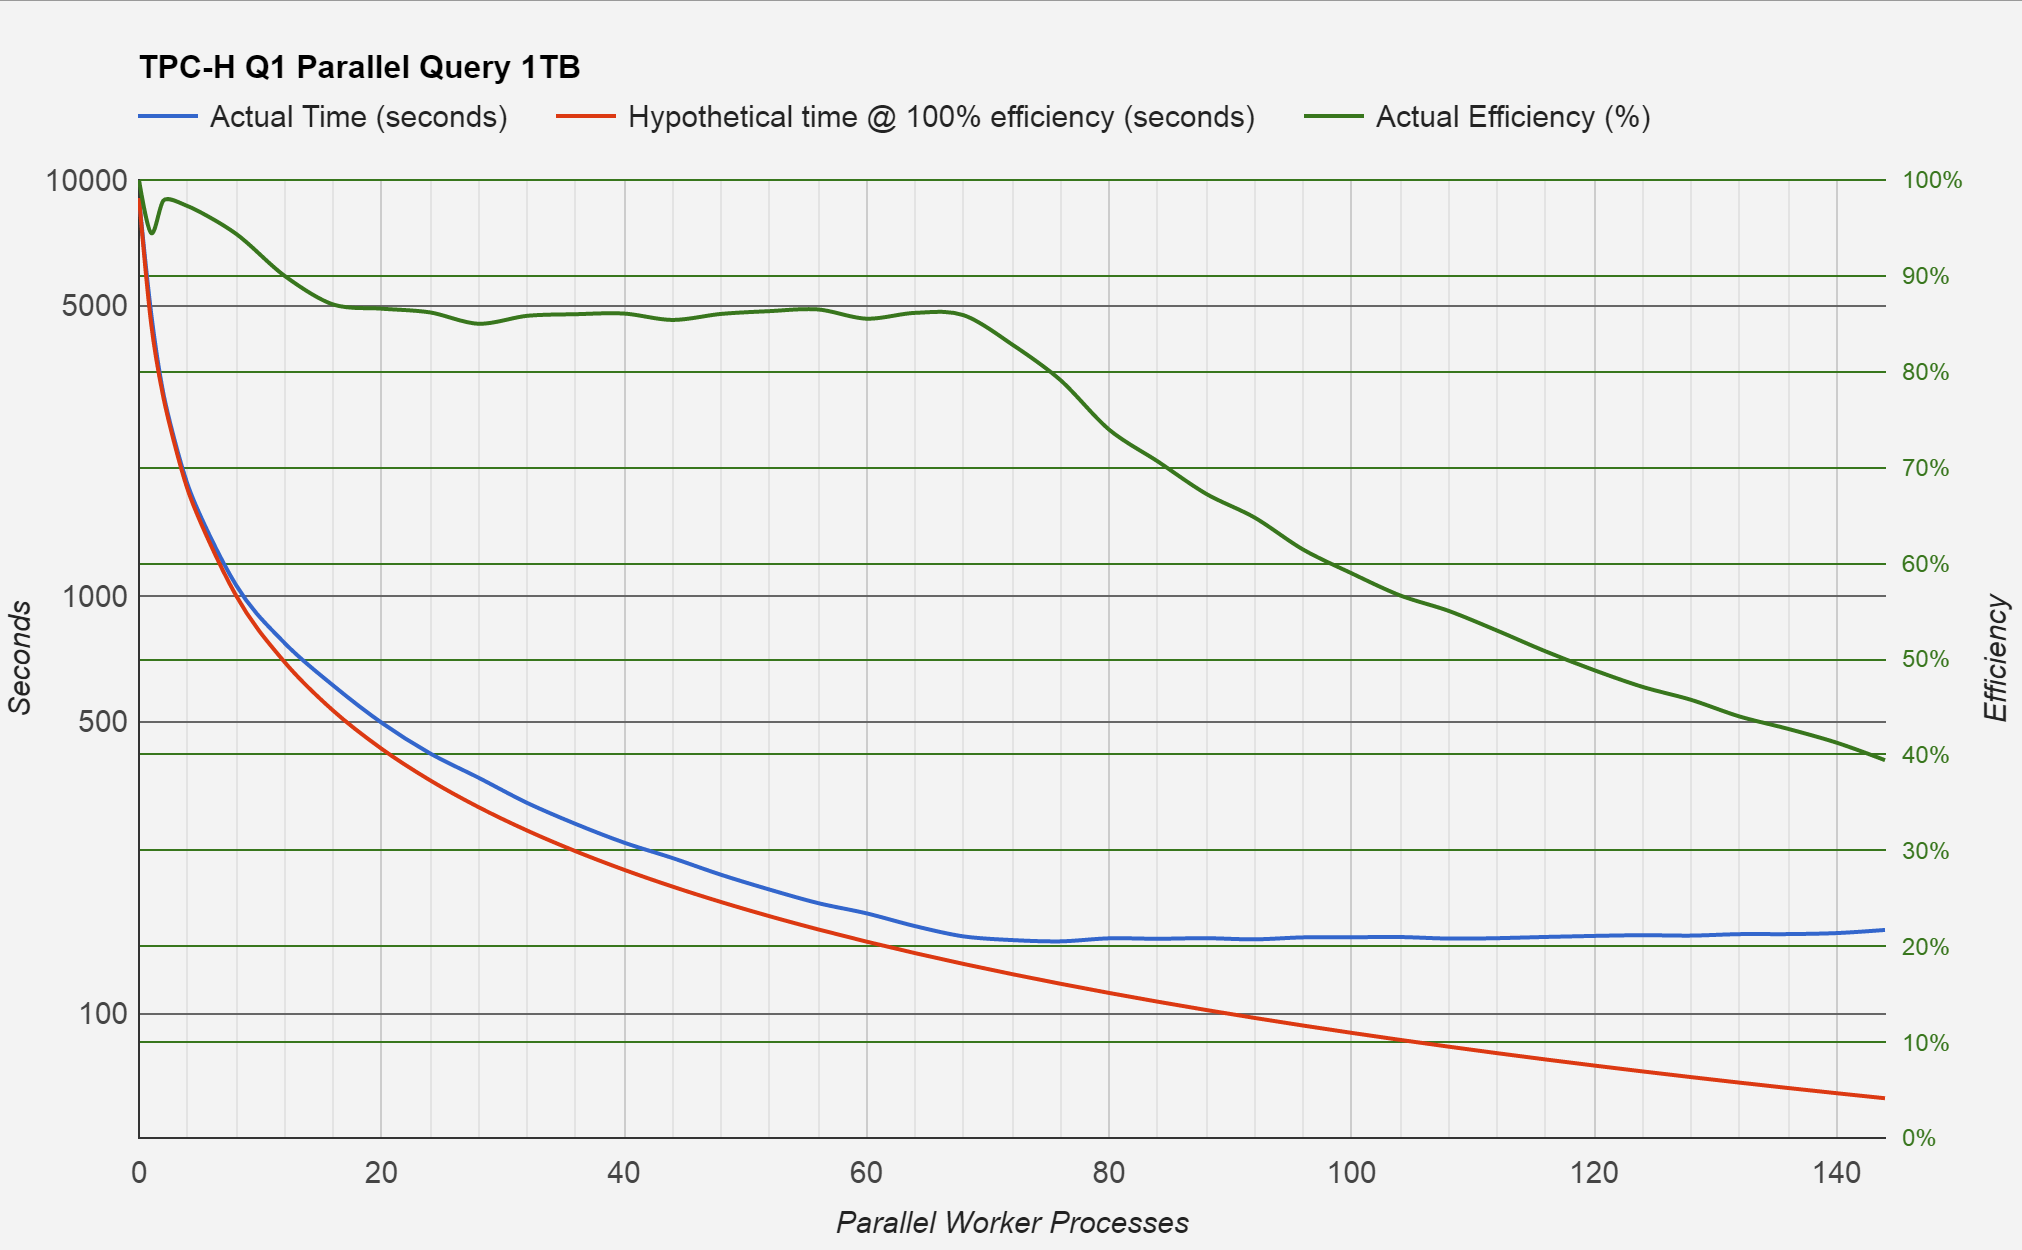
We can see that the server is able to scale quite well up until around 72 workers, where the efficiency starts dropping fast. That’s not too big a surprises giving that this server has 72 cores. In this case 100% efficiency would mean that if we went from 5 workers to 10 that the query response times would half. The red line in the chart marks this theoretical maximum, and the green line (efficiency) shows how close we actually got to this.
I created a “base time” to calculate this efficiency by simply disabling parallelism altogether, and running the query on a single CPU core, which resulted in a query time of 9052.8 seconds. The fastest times I saw were around the 72 to 76 parallel worker mark, with 149.7 and 148.6 seconds respectively. This means we got a speed up of almost 61 times! Slightly more than the 32 claimed by the release notes. Is that undersell over deliver, maybe?
And just for fun
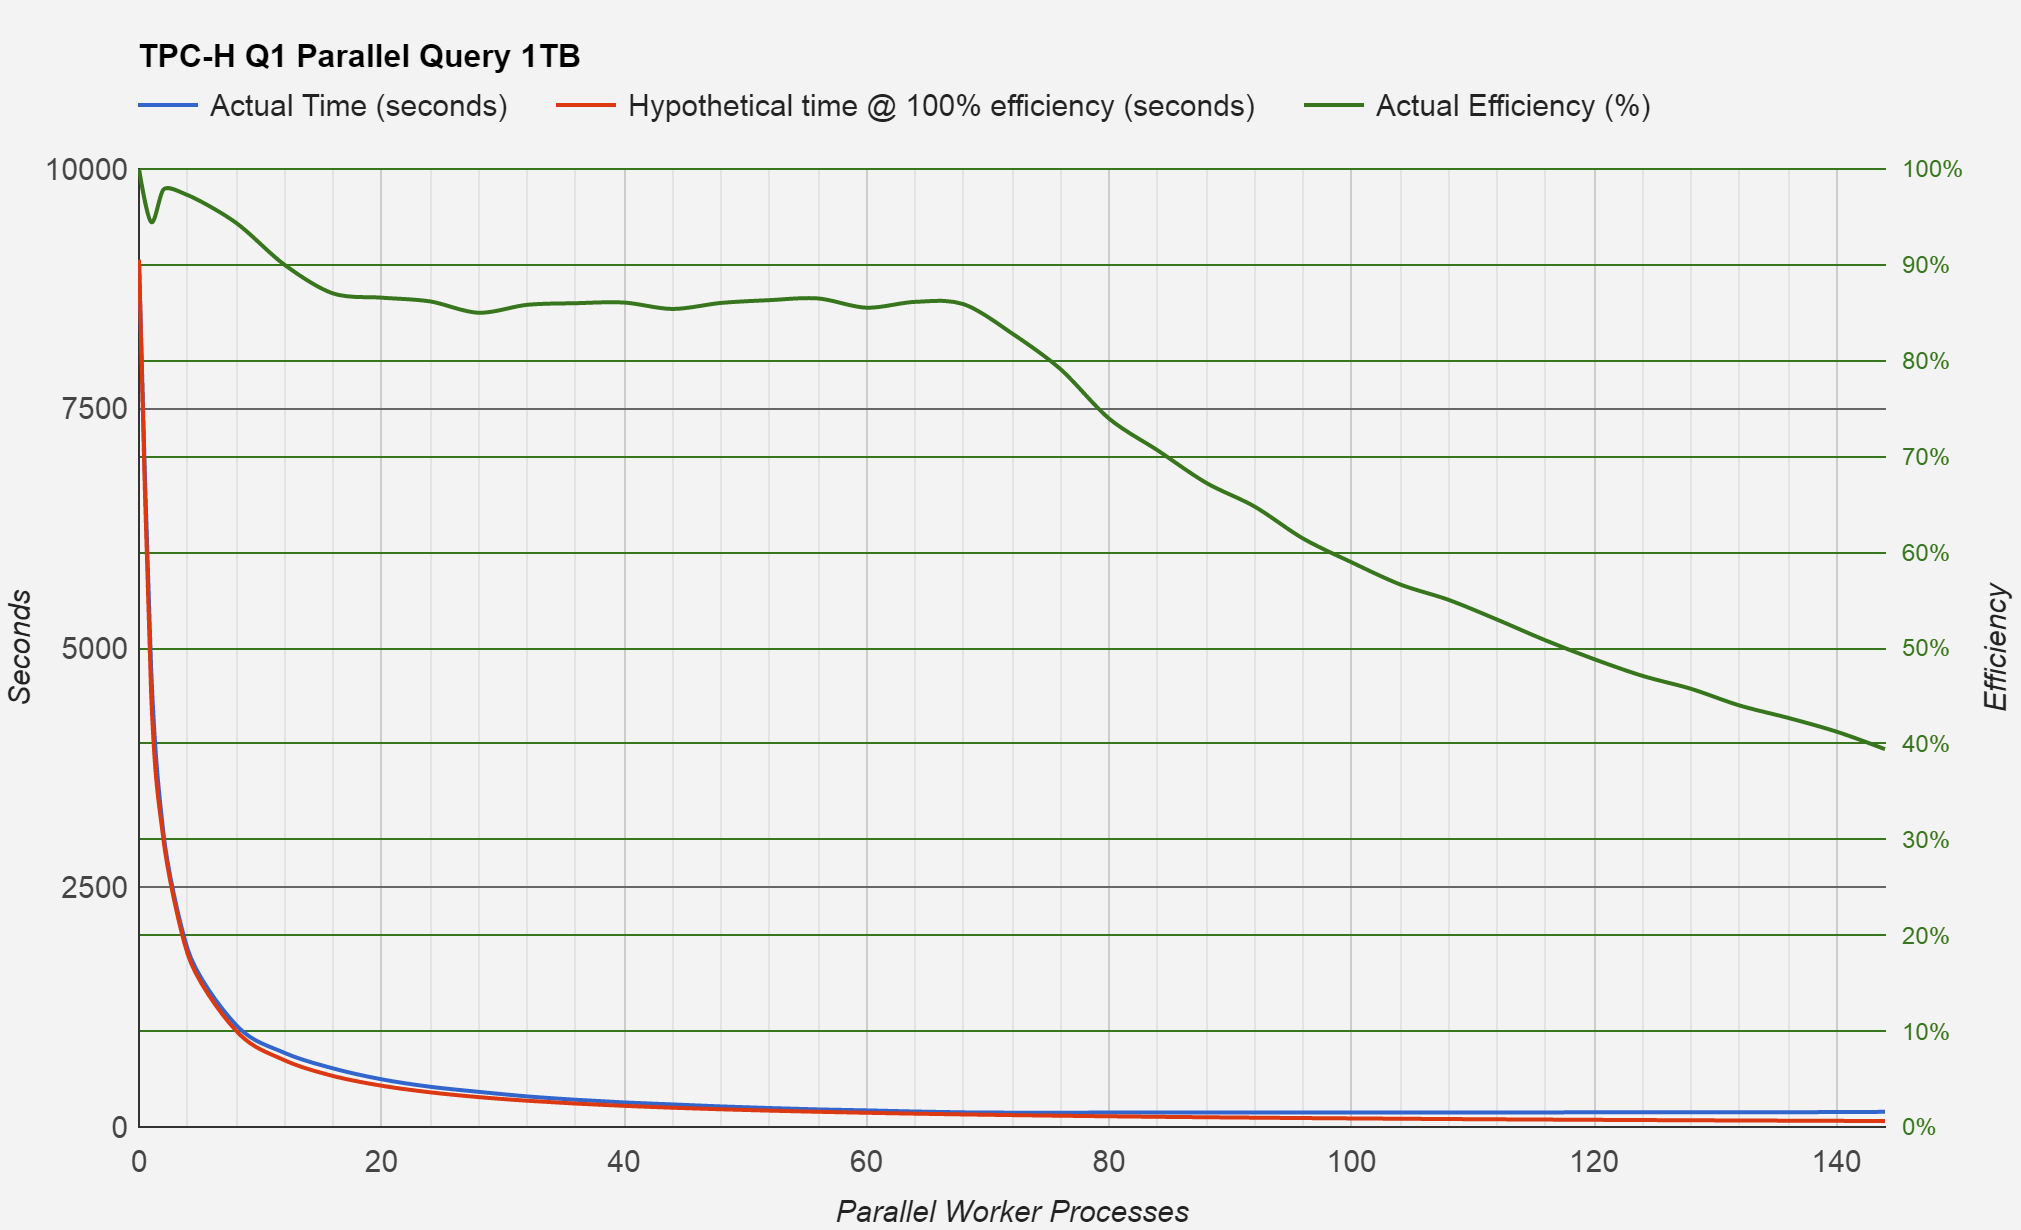
I thought I’d remove the log scale on the seconds axis, just so we can see the performance in linear time.
Not such a useful chart, but impressive how much performance has increased over the non-parallel query.
OK, so just where are the limits?
Well, I just so happened to test that too! Of course not all limits, but I wondered where the scaling would stop on this machine.
I simplified the query to become a simple SELECT COUNT(*) from lineitems; and on testing, I came hard up against the lock which the parallel workers use obtain the page number which they’re to process next. This stops two workers both processing the same page, which would give incorrect results. Within this lock, the parallel worker is only trying to get a page number to look at next, not the actual page itself. This means that the parallel worker processes were waiting for other fellow workers to simply read a 32 bit numerical value and add the value of 1 to it (so it’s ready for the next worker to read), before finally releasing the lock. Which means if we added even more CPUs, I’d have eventually hit this lock in TPCH-Q1 too.
The great news is that this will be very easy to put right, as currently the workers only take one page at a time. If we just gave them a few at once when the table is large, then that would solve that problem as each worker would have more work to do before having to check what it should to do next.
Thanks to everyone involved in making PostgreSQL a parallel processing monster!
I’m truly excited to what we can achieve here in the future.


