Full-text search since PostgreSQL 8.3
Welcome to the third – and last – part of this blog series, exploring how the PostgreSQL performance evolved over the years. The first part looked at OLTP workloads, represented by pgbench tests. The second part looked at analytical / BI queries, using a subset of the traditional TPC-H benchmark (essentially a portion of the power test).
And this final part looks at full-text search, i.e. the ability to index and search in large amounts of text data. The same infrastructure (especially the indexes) may be useful for indexing semi-structured data like JSONB documents etc. but that’s not what this benchmark is focused on.
But first, let’s look at the history of full-text search in PostgreSQL, which may seem like a strange feature to add to a RDBMS, traditionally intended for storing structured data in rows and columns.
The history of full-text search
When Postgres was open-sourced in 1996, it did not have anything we could call full-text search. But people who started using Postgres wanted to make intelligent searches in text documents, and the LIKE queries were not good enough. They wanted to be able to lemmatize the terms using dictionaries, ignore stop words, sort the matching documents by relevance, use indexes to execute those queries, and many other things. Things you can’t reasonably do with the traditional SQL operators.
Luckily, some of those people were also developers so they started working on this – and they could, thanks to PostgreSQL being available as open-source all over the world. There have been many contributors to full-text search over the years, but initially this effort was led by Oleg Bartunov and Teodor Sigaev, shown in the following photo. Both are still major PostgreSQL contributors, working on full-text searching, indexing, JSON support, and many other features.

Teodor Sigaev and Oleg Bartunov
Initially, the functionality was developed as an external “contrib” module (nowadays we’d say it’s an extension) called “tsearch”, released in 2002. Later this was obsoleted by tsearch2, significantly improving the feature in many ways, and in PostgreSQL 8.3 (released in 2008) this was fully integrated into the PostgreSQL core (i.e. without the need to install any extension at all, although the extensions were still provided for backwards compatibility).
There were many improvements since then (and the work continues, e.g. to support data types like JSONB, querying using jsonpath etc.). but these plugins introduced most of the full-text functionality we have in PostgreSQL now – dictionaries, full-text indexing and querying capabilities, etc.
The benchmark
Unlike the OLTP / TPC-H benchmarks, I’m not aware of any full-text benchmark that could be considered “industry standard” or designed for multiple database systems. Most of the benchmarks I know of are meant to be used with a single database / product, and it’s hard to port them meaningfully, so I had to take a different route and write my own full-text benchmark.
Years ago I wrote archie – a couple of python scripts that allow downloading of PostgreSQL mailing list archives, and load the parsed messages into a PostgreSQL database which then can be indexed and searched. The current snapshot of all archives has ~1M rows, and after loading it into a database the table is about 9.5GB (not counting the indexes).
As for the queries, I could probably generate some random ones, but I’m not sure how realistic that would be. Luckily, a couple years ago I obtained a sample of 33k actual searches from the PostgreSQL website (i.e. things people actually searched in the community archives). It’s unlikely I could get anything more realistic / representative.
The combination of those two parts (data set + queries) seems like a nice benchmark. We can simply load the data, and run the searches with different types of full-text queries with different types of indexes.
Queries
There are various shapes of full-text queries – the query may simply select all matching rows, it may rank the results (sort them by relevance), return just a small number or the most relevant results, etc. I did run benchmark with various types of queries, but in this post I’ll present results for two simple queries that I think represent the overall behavior quite nicely.
- SELECT id, subject FROM messages WHERE body_tsvector @@ $1
- SELECT id, subject FROM messages WHERE body_tsvector @@ $1
ORDER BY ts_rank(body_tsvector, $1) DESC LIMIT 100
The first query simply returns all matching rows, while the second one returns the 100 most relevant results (this is something you’d probably use for user searches).
I’ve experimented with various other types of queries, but all of them ultimately behaved in a way similar to one of these two query types.
Indexes
Each message has two main parts that we can search in – subject and body. Each of them has a separate tsvector column, and is indexed separately. The message subjects are much shorter than bodies, so the indexes are naturally smaller.
PostgreSQL has two types of indexes useful for full-text search – GIN and GiST. The main differences are explained in the docs, but in short:
- GIN indexes are faster for searches
- GiST indexes are lossy, i.e. require recheck during searches (and so are slower)
We used to claim GiST indexes are cheaper to update (especially with many concurrent sessions), but this was removed from the documentation some time ago, due to improvements in the indexing code.
This benchmark does not test behavior with updates – it simply loads the table without the full-text indexes, builds them in one go, and then executes the 33k queries on the data. That means I can’t make any statements about how those index types handle concurrent updates based on this benchmark, but I believe the documentation changes reflect various recent GIN improvements.
This should also match the mailing list archive use case quite well, where we’d only append new emails once in a while (few updates, almost no write concurrency). But if your application does a lot of concurrent updates, you’ll need to benchmark that on your own.
The hardware
I did the benchmark on the same two machines as before, but the results/conclusions are nearly identical, so I’ll only present the numbers from the smaller one, i.e.
- CPU i5-2500K (4 cores/threads)
- 8GB RAM
- 6 x 100GB SSD RAID0
- kernel 5.6.15, ext4 filesystem
I’ve previously mentioned the data set has almost 10GB when loaded, so it’s larger than RAM. But the indexes are still smaller than RAM, which is what matters for the benchmark.
Results
OK, time for some numbers and charts. I’ll present results for both data loads and querying, first with GIN and then with GiST indexes.
GIN / data load
The load is not particularly interesting, I think. Firstly, most of it (the blue part) has nothing to do with full-text, because it happens before the two indexes are created. Most of this time is spent parsing the messages, re-building the mail threads, maintaining the list of replies, and so on. Some of this code is implemented in PL/pgSQL triggers, some of it is implemented outside the database. The one part potentially relevant to full-text is building the tsvectors, but it’s impossible to isolate the time spent on that.
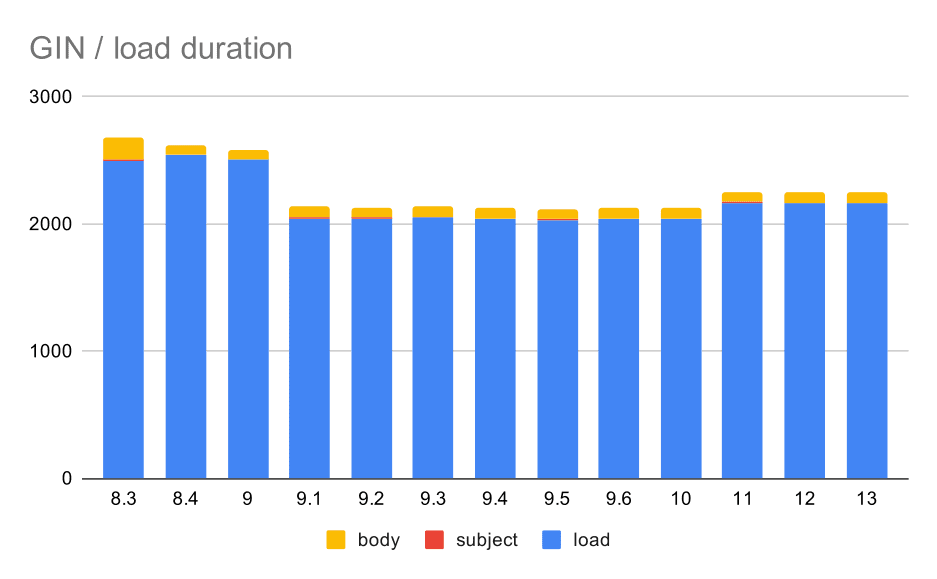
Data load operations with a table and GIN indexes.
The following table shows the source data for this chart – values are duration in seconds. LOAD includes parsing of the mbox archives (from a Python script), inserting into a table and various additional tasks (rebuilding e-mail threads, etc.). The SUBJECT/BODY INDEX refer to creation of full-text GIN index on the subject/body columns after the data is loaded.
| LOAD | SUBJECT INDEX | BODY INDEX | |
| 8,3 | 2501 | 8 | 173 |
| 8.4 | 2540 | 4 | 78 |
| 9.0 | 2502 | 4 | 75 |
| 9.1 | 2046 | 4 | 84 |
| 9.2 | 2045 | 3 | 85 |
| 9.3 | 2049 | 4 | 85 |
| 9.4 | 2043 | 4 | 85 |
| 9.5 | 2034 | 4 | 82 |
| 9.6 | 2039 | 4 | 81 |
| 10 | 2037 | 4 | 82 |
| 11 | 2169 | 4 | 82 |
| 12 | 2164 | 4 | 79 |
| 13 | 2164 | 4 | 81 |
Clearly, the performance is pretty stable – there has been a fairly significant improvement (roughly 20%) between 9.0 and 9.1. I’m not quite sure which change could be responsible for this improvement – nothing in the 9.1 release notes seems clearly relevant. There’s also a clear improvement in building of the GIN indexes in 8.4, which cuts the time about in half. Which is nice, of course. Interestingly enough, I don’t see any obviously related release notes item for this either.
What about sizes of the GIN indexes, though? There’s a lot more variability, at least until 9.4, at which point the size of indexes drops from ~1GB to only about 670MB (roughly 30%).
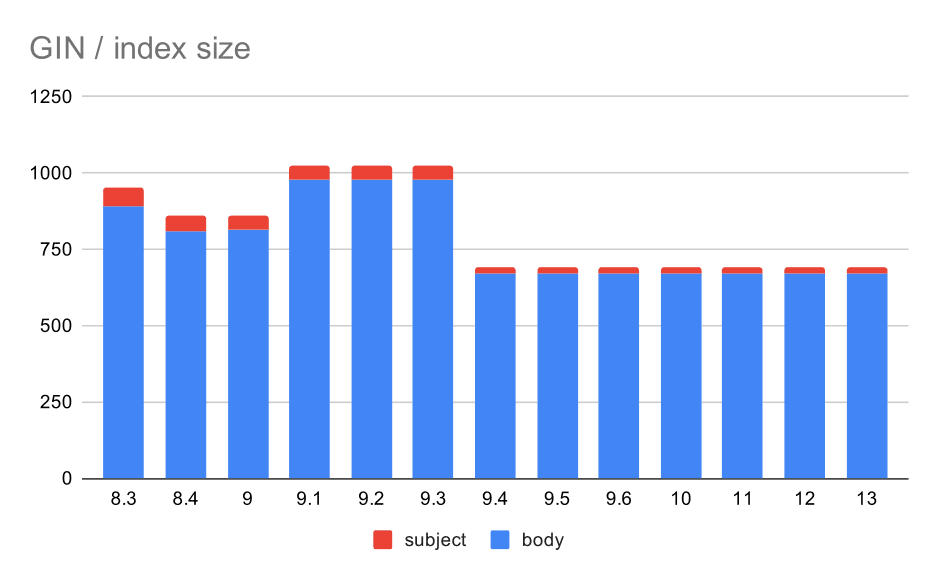
Size of GIN indexes on message subject/body. Values are megabytes.
The following table shows the sizes of GIN indexes on message body and subject. The values are in megabytes.
| BODY | SUBJECT | |
| 8.3 | 890 | 62 |
| 8.4 | 811 | 47 |
| 9.0 | 813 | 47 |
| 9.1 | 977 | 47 |
| 9.2 | 978 | 47 |
| 9.3 | 977 | 47 |
| 9.4 | 671 | 20 |
| 9.5 | 671 | 20 |
| 9.6 | 671 | 20 |
| 10 | 672 | 20 |
| 11 | 672 | 20 |
| 12 | 672 | 20 |
| 13 | 672 | 20 |
In this case, I think we can safely assume this speed-up is related to this item in 9.4 release notes:
- Reduce GIN index size (Alexander Korotkov, Heikki Linnakangas)
The size variability between 8.3 and 9.1 seems to be due to changes in lemmatisation (how words are transformed to the “basic” form). Aside from the size differences, the queries on those versions do return slightly different numbers of results, for example.
GIN / queries
Now, the main part of this benchmark – query performance. All the numbers presented here are for a single client – we’ve already discussed client scalability in the part related to OLTP performance, the findings apply to these queries too. (Moreover, this particular machine only has 4 cores, so we wouldn’t get very far in terms of scalability testing anyway.)
SELECT id, subject FROM messages WHERE tsvector @@ $1
First, the query searching for all matching documents. For searches in the “subject” column we can do about 800 queries per second (and it actually drops a bit in 9.1), but in 9.4 it suddenly shoots up to 3000 queries per second. For the “body” column it’s basically the same story – 160 queries initially, a drop to ~90 queries in 9.1, and then an increase to 300 in 9.4.
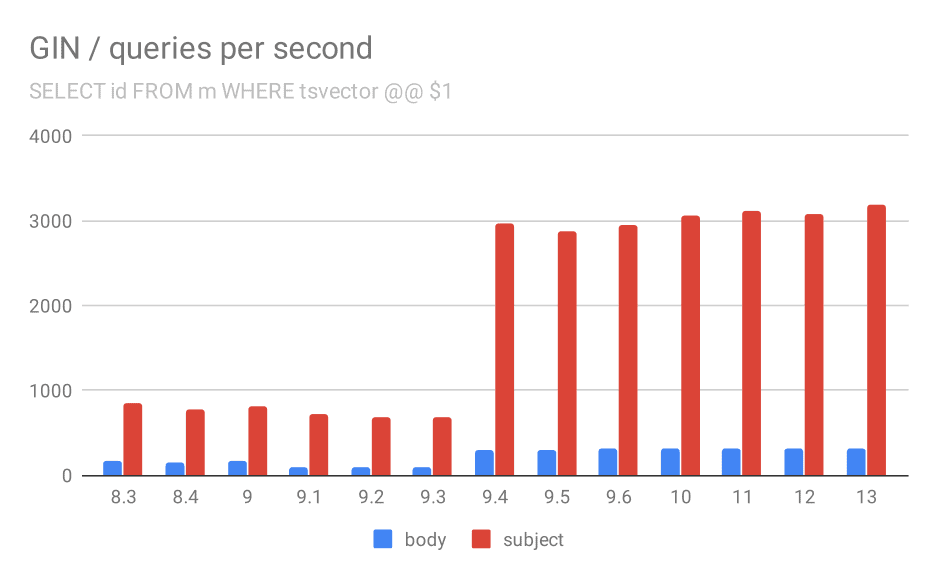
Number of queries per second for the first query (fetching all matching rows).
And again, the source data – the numbers are throughput (queries per second).
| BODY | SUBJECT | |
| 8.3 | 168 | 848 |
| 8.4 | 155 | 774 |
| 9.0 | 160 | 816 |
| 9.1 | 93 | 712 |
| 9.2 | 93 | 675 |
| 9.3 | 95 | 692 |
| 9.4 | 303 | 2966 |
| 9.5 | 303 | 2871 |
| 9.6 | 310 | 2942 |
| 10 | 311 | 3066 |
| 11 | 317 | 3121 |
| 12 | 312 | 3085 |
| 13 | 320 | 3192 |
I think we can safely assume the improvement in 9.4 is related to this item in release notes:
- Improve speed of multi-key GIN lookups (Alexander Korotkov, Heikki Linnakangas)
So, another 9.4 improvement in GIN from the same two developers – clearly, Alexander and Heikki did a lot of good work on GIN indexes in the 9.4 release 😉
SELECT id, subject FROM messages WHERE tsvector @@ $1
ORDER BY ts_rank(tsvector, $2) DESC LIMIT 100
For the query ranking the results by relevance using ts_rank and LIMIT, the overall behavior is almost exactly the same, no need to describe the chart in detail, I think.
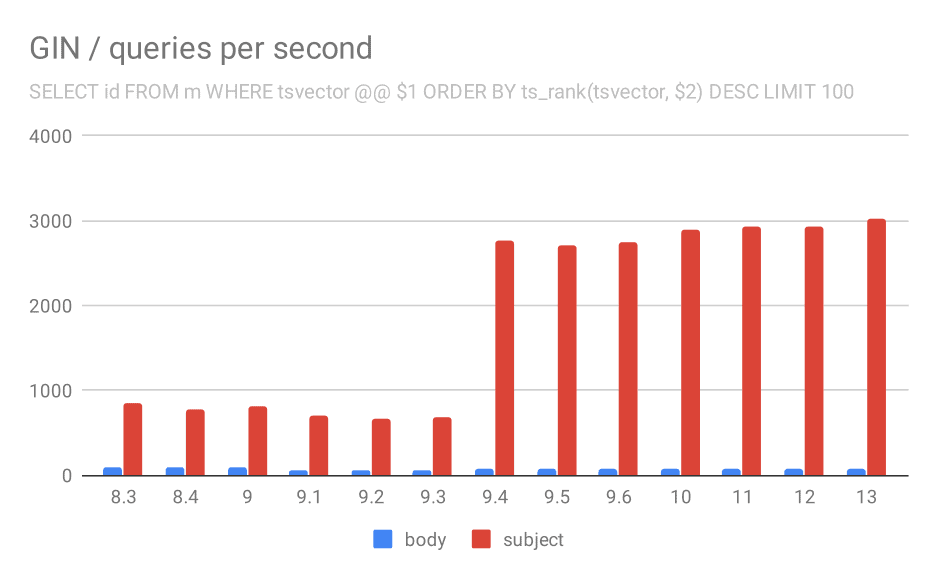
Number of queries per second for the second query (fetching the most relevant rows).
| BODY | SUBJECT | |
| 8.3 | 94 | 840 |
| 8.4 | 98 | 775 |
| 9.0 | 102 | 818 |
| 9.1 | 51 | 704 |
| 9.2 | 51 | 666 |
| 9.3 | 51 | 678 |
| 9.4 | 80 | 2766 |
| 9.5 | 81 | 2704 |
| 9.6 | 78 | 2750 |
| 10 | 78 | 2886 |
| 11 | 79 | 2938 |
| 12 | 78 | 2924 |
| 13 | 77 | 3028 |
There’s one question, though – why did the performance drop between 9.0 and 9.1? There seems to be a pretty significant drop in throughput – by about 50% for the body searches and 20% for searches in message subjects. I don’t have a clear explanation what happened, but I have two observations …
Firstly, the index size changed – if you look at the first chart “GIN / index size” and the table, you’ll see the index on message bodies grew from 813MB to about 977MB. That’s a significant increase, and it might explain some of the slowdown. The problem however is that the index on subjects did not grow at all, yet the queries got slower too.
Secondly, we can look at how many results the queries returned. The indexed data set is exactly the same, so it seems reasonable to expect the same number of results in all PostgreSQL versions, right? Well, in practice it looks like this:
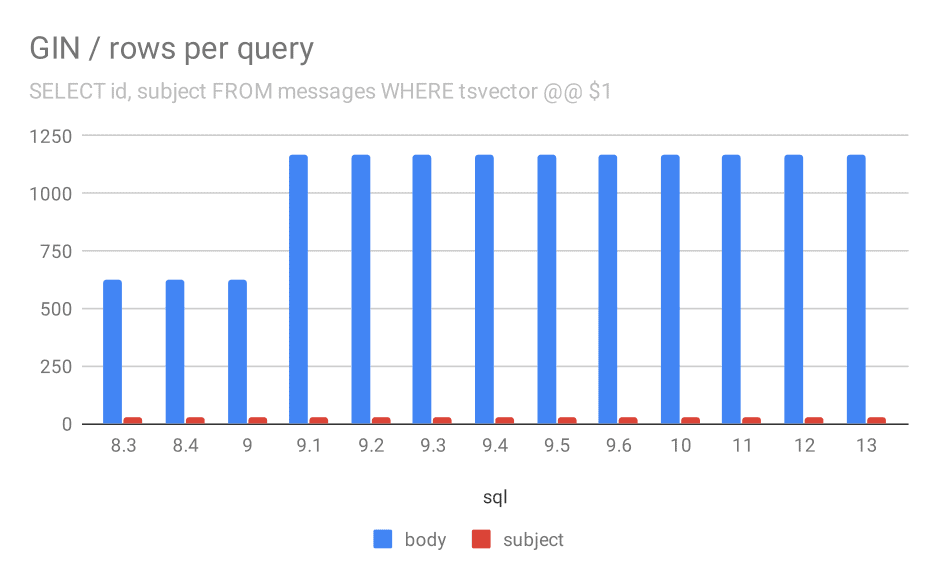
Number of rows returned for a query on average.
| BODY | SUBJECT | |
| 8.3 | 624 | 26 |
| 8.4 | 624 | 26 |
| 9.0 | 622 | 26 |
| 9.1 | 1165 | 26 |
| 9.2 | 1165 | 26 |
| 9.3 | 1165 | 26 |
| 9.4 | 1165 | 26 |
| 9.5 | 1165 | 26 |
| 9.6 | 1165 | 26 |
| 10 | 1165 | 26 |
| 11 | 1165 | 26 |
| 12 | 1165 | 26 |
| 13 | 1165 | 26 |
Clearly, in 9.1 the average number of results for searches in message bodies suddenly doubles, which is almost perfectly proportional to the slowdown. However the number of results for subject searches remains the same. I don’t have a very good explanation for this, except that the indexing changed in a way that allows matching more messages, but making it a bit slower. If you have better explanations, I’d like to hear them!
GiST / data load
Now, the other type of full-text indexes – GiST. These indexes are lossy, i.e. require recheck of the results using values from the table. So we can expect lower throughput compared to the GIN indexes, but otherwise it’s reasonable to expect roughly the same pattern.
The load times do indeed match the GIN almost perfectly – the index creation times are different, but the overall pattern is the same. Speedup in 9.1, small slowdown in 11.

Data load operations with a table and GiST indexes.
| LOAD | SUBJECT | BODY | |
| 8.3 | 2522 | 23 | 47 |
| 8.4 | 2527 | 23 | 49 |
| 9.0 | 2511 | 23 | 45 |
| 9.1 | 2054 | 22 | 46 |
| 9.2 | 2067 | 22 | 47 |
| 9.3 | 2049 | 23 | 46 |
| 9.4 | 2055 | 23 | 47 |
| 9.5 | 2038 | 22 | 45 |
| 9.6 | 2052 | 22 | 44 |
| 10 | 2029 | 22 | 49 |
| 11 | 2174 | 22 | 46 |
| 12 | 2162 | 22 | 46 |
| 13 | 2170 | 22 | 44 |
The index size however remained almost constant – there were no GiST improvements similar to GIN in 9.4, which reduced the size by ~30%. There’s an increase in 9.1, which is another sign that the full-text indexing changed in that version to index more words.
This is further supported by the average number of results with GiST being exactly the same as for GIN (with an increase in 9.1).
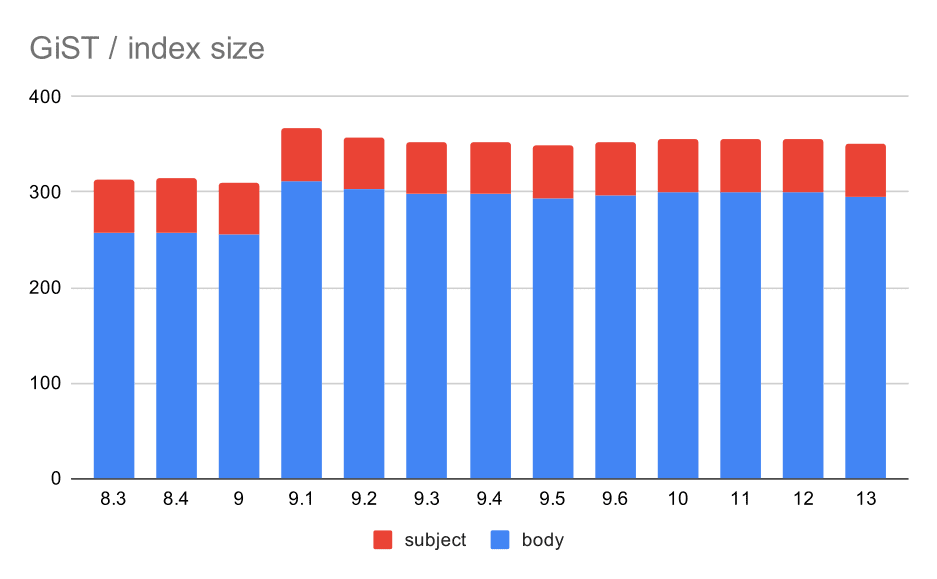
Size of GiST indexes on message subject/body. Values are megabytes.
| BODY | SUBJECT | |
| 8.3 | 257 | 56 |
| 8.4 | 258 | 56 |
| 9.0 | 255 | 55 |
| 9.1 | 312 | 55 |
| 9.2 | 303 | 55 |
| 9.3 | 298 | 55 |
| 9.4 | 298 | 55 |
| 9.5 | 294 | 55 |
| 9.6 | 297 | 55 |
| 10 | 300 | 55 |
| 11 | 300 | 55 |
| 12 | 300 | 55 |
| 13 | 295 | 55 |
GiST / queries
Unfortunately, for the queries the results are nowhere as good as for GIN, where the throughput more than tripled in 9.4. With GiST indexes, we actually observe continuous degradation over the time.
SELECT id, subject FROM messages WHERE tsvector @@ $1
Even if we ignore versions before 9.1 (due to the indexes being smaller and returning fewer results faster), the throughput drops from ~270 to ~200 queries per second, with the main drop between 9.2 and 9.3.
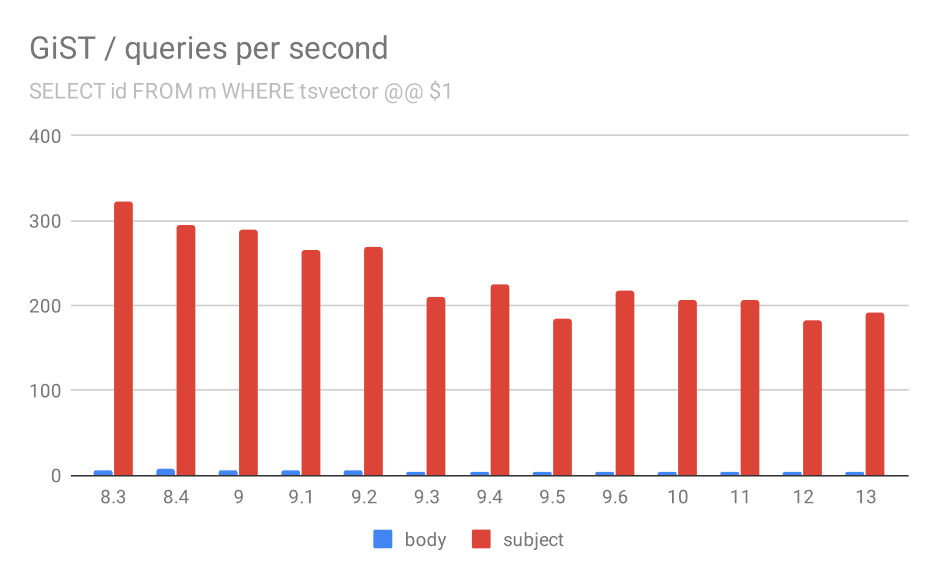
Number of queries per second for the first query (fetching all matching rows).
| BODY | SUBJECT | |
| 8.3 | 5 | 322 |
| 8.4 | 7 | 295 |
| 9.0 | 6 | 290 |
| 9.1 | 5 | 265 |
| 9.2 | 5 | 269 |
| 9.3 | 4 | 211 |
| 9.4 | 4 | 225 |
| 9.5 | 4 | 185 |
| 9.6 | 4 | 217 |
| 10 | 4 | 206 |
| 11 | 4 | 206 |
| 12 | 4 | 183 |
| 13 | 4 | 191 |
SELECT id, subject FROM messages WHERE tsvector @@ $1
ORDER BY ts_rank(tsvector, $2) DESC LIMIT 100
And for queries with ts_rank the behavior is almost exactly the same.
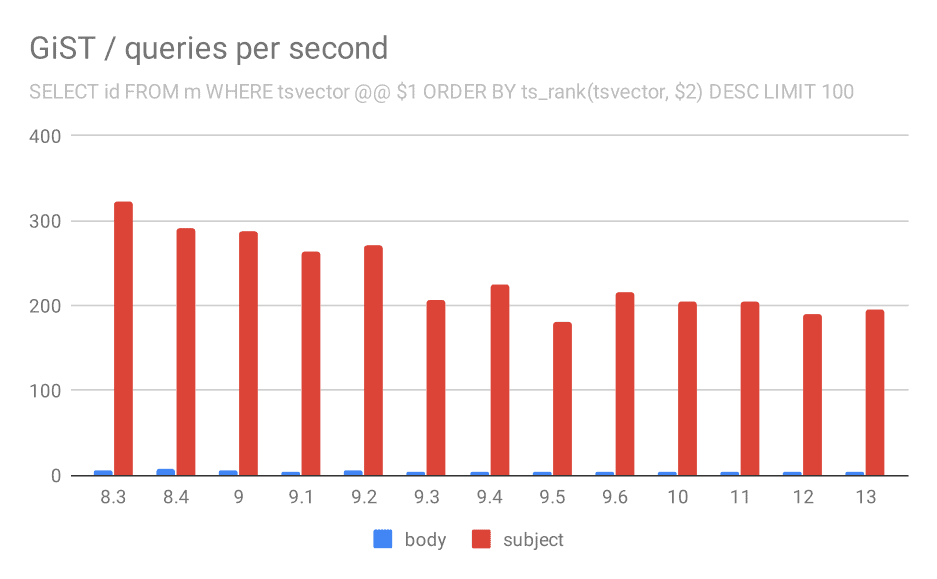
Number of queries per second for the second query (fetching the most relevant rows).
| BODY | SUBJECT | |
| 8.3 | 5 | 323 |
| 8.4 | 7 | 291 |
| 9.0 | 6 | 288 |
| 9.1 | 4 | 264 |
| 9.2 | 5 | 270 |
| 9.3 | 4 | 207 |
| 9.4 | 4 | 224 |
| 9.5 | 4 | 181 |
| 9.6 | 4 | 216 |
| 10 | 4 | 205 |
| 11 | 4 | 205 |
| 12 | 4 | 189 |
| 13 | 4 | 195 |
I’m not entirely sure what’s causing this, but it seems like a potentially serious regression sometime in the past, and it might be interesting to know what exactly changed.
It’s true no one complained about this until now – possibly thanks to upgrading to a faster hardware which masked the impact, or maybe because if you really care about speed of the searches you will prefer GIN indexes anyway.
But we can also see this as an optimization opportunity – if we identify what caused the regression and we manage to undo that, it might mean ~30% speedup for GiST indexes.
Summary and future
By now I’ve (hopefully) convinced you there were many significant improvements since PostgreSQL 8.3 (and in 9.4 in particular). I don’t know how much faster can this be made, but I hope we’ll investigate at least some of the regressions in GiST (even if performance-sensitive systems are likely using GIN). Oleg and Teodor and their colleagues were working on more powerful variants of the GIN indexing, named VODKA and RUM (I kinda see a naming pattern here!), and this will probably help at least some query types.
I do however expect to see features buil extending the existing full-text capabilities – either to better support new query types (e.g. the new index types are designed to speed up phrase search), data types and things introduced by recent revisions of the SQL standard (like jsonpath).
