Harnessing Shared Buffers (and Reaping the Performance Benefits) - Part 1

Anyone who’s deployed a Postgres or EPAS service eventually reaches a point where they must make a grueling decision: how to set shared_buffers? The more conventional wisdom suggests using a quarter of RAM and perhaps adjusting in the future if necessary. That’s the exact advice the PGConfig and PGTune utilities follow when making suggestions for multiple configuration settings.
Is that really what we want on modern systems, though? It’s not too uncommon for a well-equipped Postgres server to wield 1TB of RAM, and do we want to dedicate 256GB to Postgres Shared Buffers? Is that even a good idea anymore? Was it ever?
To answer these questions (and others besides), we ran a battery of benchmarks on Postgres 14 by varying Shared Buffers from the default all the way to half of a server’s RAM.
Enter antiquation
Dave Page recently shared EDBs Ansible benchmark framework one of our internal teams is using for building a system to automatically tune Postgres. Part of that testing includes multiple executions on hardware of varying description with varying parameter values to tune and train all of the advisors and integrated AI layers.
Invariably, this meant benchmarking a technology that is quickly approaching full deprecation in the age of falling SSD prices: hard disk drives. The venerable HDD has certainly played a crucial role in shaping several technologies, and Postgres is no exception. To that end, EDB has four servers available for exploring HDD performance. Each consists of an HP Proliant DL360 server equipped with dual Xeon E5-2630 v4 CPUs (40 threads), 64GB of RAM, and four 2.5-inch 7200 RPM HDDs at 2TB capacity, configured for RAID-10.
The hardware itself is contemporary to 2016-era systems, though the storage is probably slightly under-provisioned at four paltry spindles of spinning rust. Still, the servers themselves are otherwise well equipped, and Shared Buffers is meant to overcome slow storage anyway. So how did that turn out?
Old faithful pgbench
Probably one of the most familiar benchmark utilities associated with Postgres is pgbench. Given an initial bootstrap scale, it will ceaselessly submit a database to an onslaught of simple transactions that look like this:
BEGIN;
UPDATE pgbench_accounts SET abalance = abalance + :delta WHERE aid = :aid;
SELECT abalance FROM pgbench_accounts WHERE aid = :aid;
UPDATE pgbench_tellers SET tbalance = tbalance + :delta WHERE tid = :tid;
UPDATE pgbench_branches SET bbalance = bbalance + :delta WHERE bid = :bid;
INSERT INTO pgbench_history (tid, bid, aid, delta, mtime) VALUES (:tid, :bid, :aid, :delta, CURRENT_TIMESTAMP);
END;
In this particular case, we initialized a pgbench database with a scale of 7,500 for a database size of about 110GB. That scale also fills the pgbench_account table with 750-million rows. This is more data than we can fit in RAM, so this should adequately stress the storage layer. Our benchmark suite also flushes filesystem cache and buffers between tests, so results should be reasonably stable. We ran all tests with 225 clients for one hour to properly saturate the system CPU threads.
This is what we found:
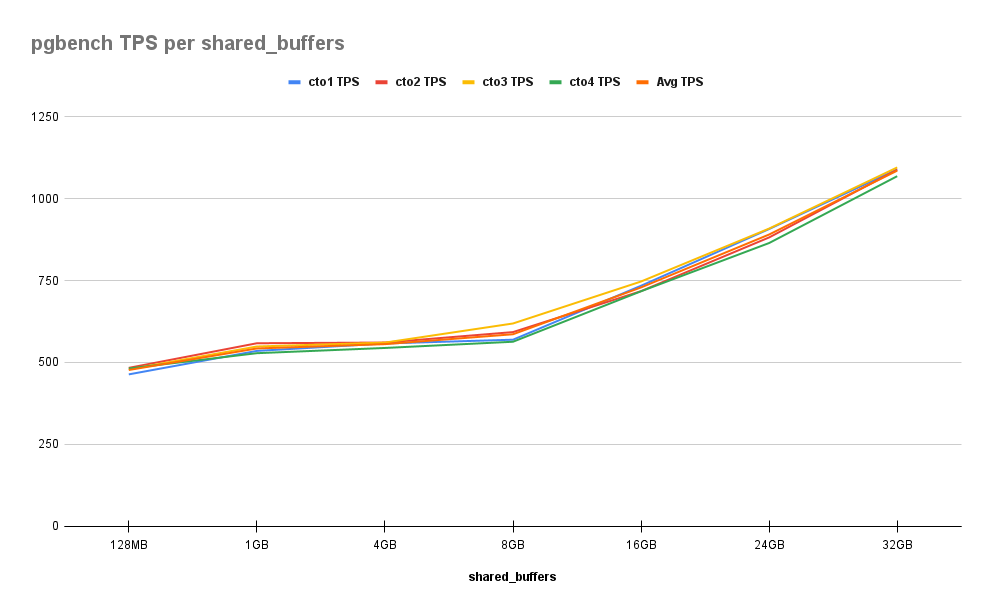
As we can see here, improvements are fairly consistent across the board. Increasing from 128MB to 1GB gives us an initial 14% improvement, but the graph remains relatively flat until 16GB where the cumulative percentage is 53%. After that, each 8GB step provides a further 30% increase, ending at 128% by the time we reach 32GB. This is notable because that’s half of the RAM allocated to these servers.
We should point out that a benchmark like pgbench should increase almost linearly with how much of the data will fit in Shared Buffers. If we examine the statements issued during each transaction, all of the values listed are determined via random seed. This means any of the 1-billion rows may be modified during a benchmark, and thus performance will increase as we can fit more of these into some combination of the filesystem cache or Shared Buffers.
Most applications don’t fit that kind of access pattern, instead having a more active subset of recent data or is grouped by accounts of varying transaction volume. So let’s try something a bit more representative.
For reference, this is how often blocks were being visited while in Shared Buffers by the time we reached 32GB on the cto1 server:
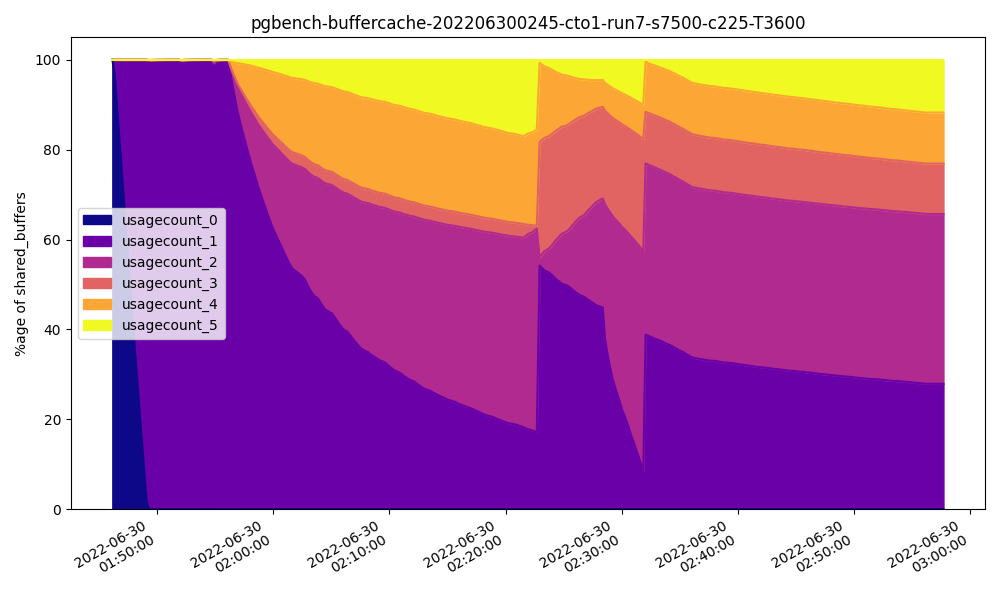
Note how rarely pages are accessed five times or more.
Fast HammerDB strikes
One of the more notorious database benchmarks is the TPC-C OLTP test. Unlike pgbench, it attempts to simulate a real business application with an active dataset where clients can focus on specific warehouses. This gives us a more representative view of what an application might actually do as memory becomes available.
All TPC implementations are strictly regulated before they can use that name, even if all stated designs are followed. Luckily, HammerDB provides a compatible implementation they designate TPROC-C, which simulates all of the requisite warehouses, clients, terminals, and so on. In our case, we initialized 1125 warehouses distributed over 15 schema users and ran benchmarks with 225 clients for one hour. Like the pgbench database, the total database size was around 110GB.
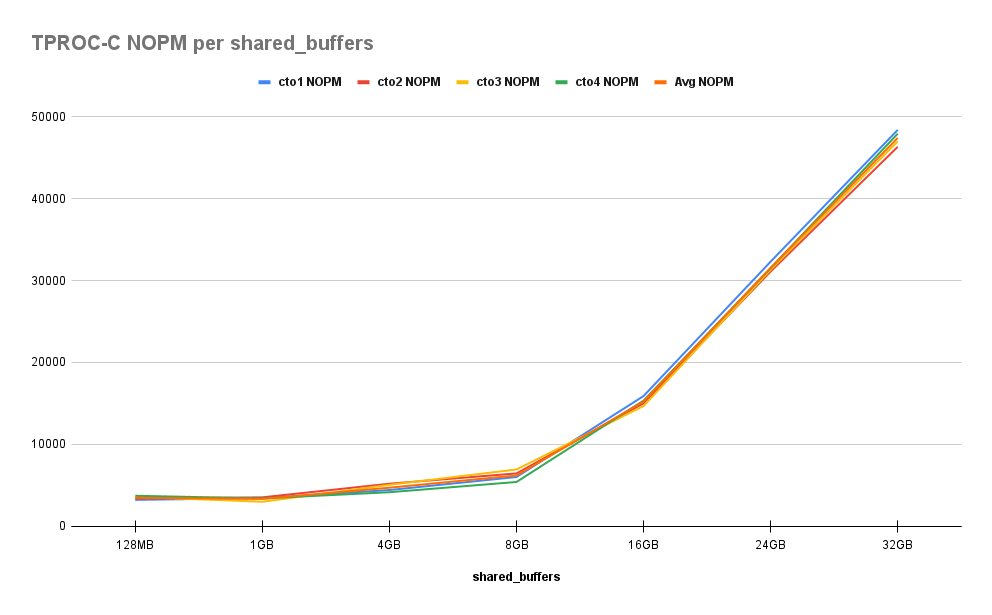
Incidentally, the results here are similar to what we found in pgbench. First the New Orders Per Minute (NOPM) results:
Then the Transactions Per Minute (TPM) results:
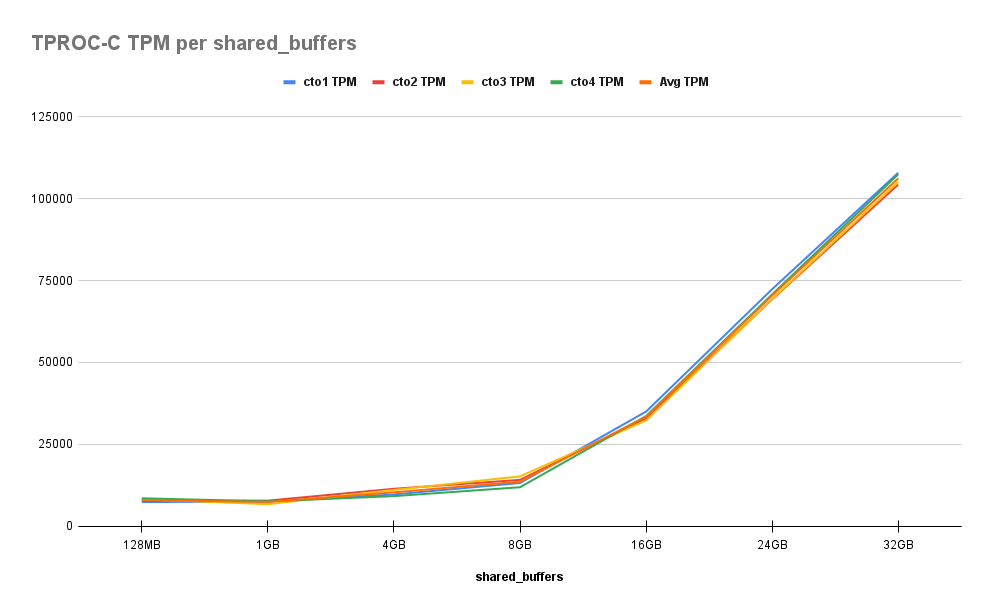
As we can see, behavior here is even more pronounced. Even with 225 clients, this benchmark will create “hot” spots in the data being manipulated. As we approach the total size of the active set, we’ll quickly observe performance boosts. While there’s little variance when we increase from 128MB to 1GB, we then witness 30%, 70%, 300%, 800%, and finally 1200% improvement over baseline by the time we reach half system RAM.
This time, the Shared Buffer usage pattern at 32GB is quite different from what we saw with pgbench:
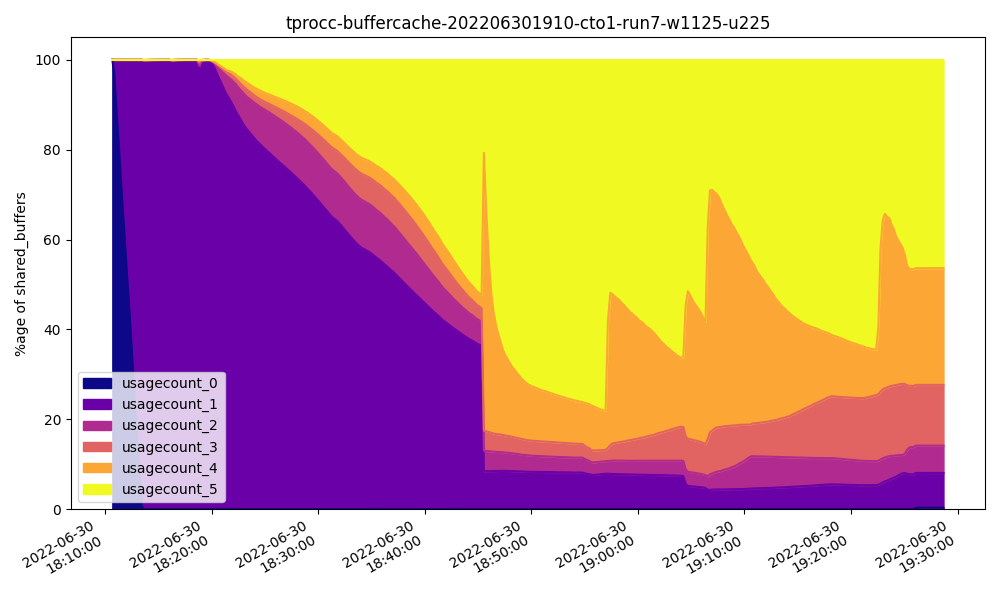
This time it’s clear that most of the buffers are visited frequently, which accounts for the nearly exponential performance curve. Were we to substitute a value for Shared Buffers roughly equal to the active dataset, our curve would eventually reach equilibrium where further increases provide no benefit.
Once again it seems that “more is better” when it comes to Shared Buffers, even when we go well past the common advice of using ¼ of system RAM. In this case, we don’t quite know the size of the active dataset, but we’ll continue to benefit by increasing Shared Buffers until we reach that point.
Swinging HammerDB slowly
Another common database benchmark, again from the TPC group, is TPC-H. Unlike pgbench and TPC-C, it focuses on large queries with lots of joins and aggregates, more appropriate in an OLAP context. This lets us test big and slow read-heavy queries that will cause a completely different type of storage access pattern.
As with TPROC-C, HammerDB provides its own equivalent for TPC-H that it—appropriately enough—calls TPROC-H. This time we initialized with a scale factor of 30 using three virtual users, and ran all benchmarks with 15 threads. Sizing TPROC-H databases is a bit more complicated than the other benchmarks, so we ended up with a 62GB database for these tests. Despite that, results weren’t quite what we were expecting:
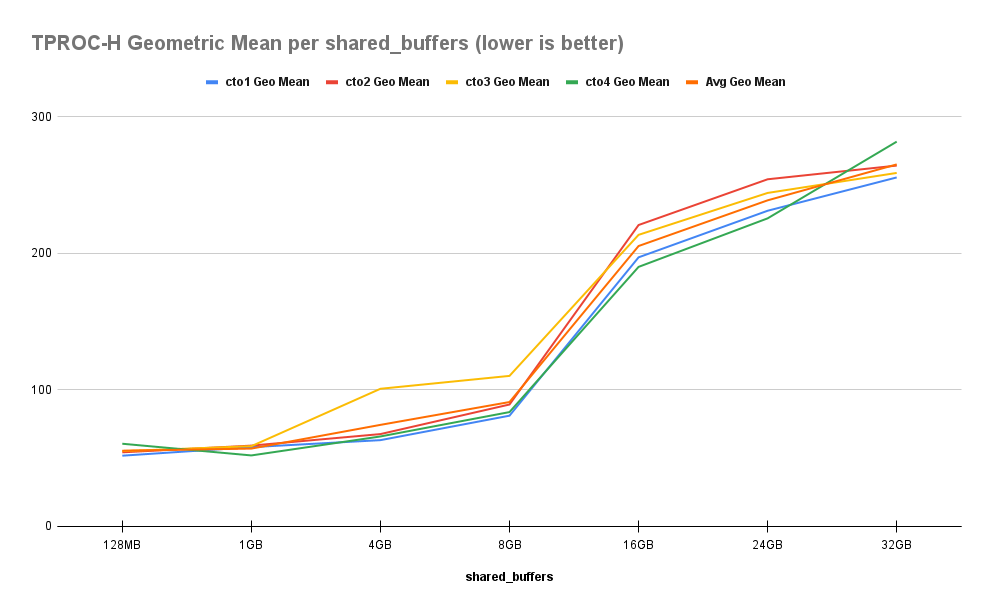
Unlike the other tests which measure pure throughput, TPROC-H actually measures geometric mean query run time. Subsequently, every time we increase shared buffers for these TPROC-H benchmarks, queries actually get slower. This is despite the fact that the entire dataset could theoretically fit in system RAM. By the time we reach 32GB of Shared Buffers, queries are 380% slower than when we started.
How is this possible? Let’s take a look at the Shared Buffer usage pattern at 32GB:
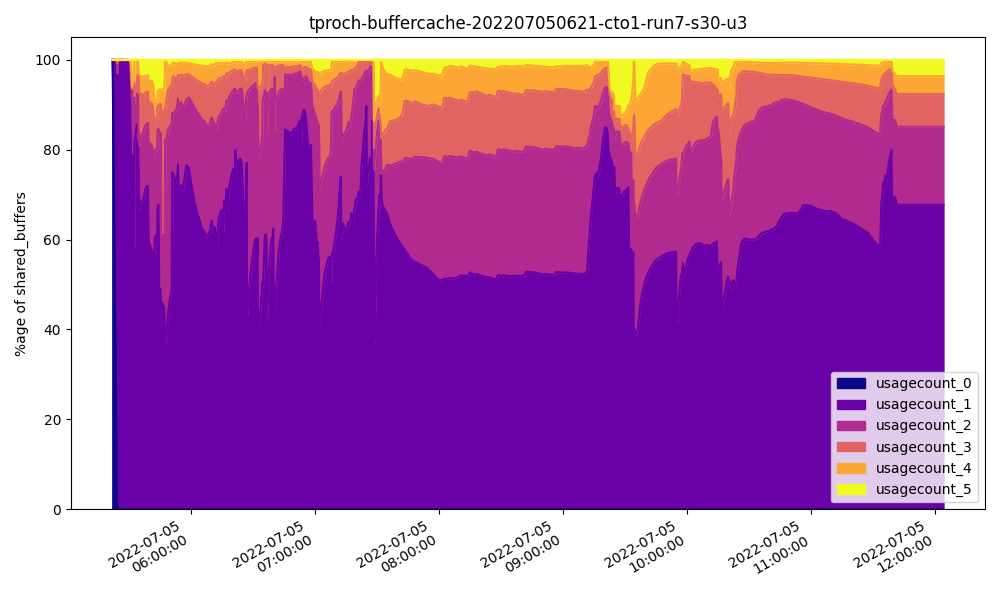
Unlike the other two benchmarks, more than half of all pages in Shared Buffers are only ever visited a single time, even at 32GB! Further, each query is likely to leverage large portions of the underlying tables, and necessitate even more memory for the working set. The more memory we assign to Shared Buffers, the less is available for this kind of ad-hoc usage.
Another way to say this is: if we assign 32GB to Shared Buffers, that only leaves 32GB for filesystem caching and free RAM for sorts, joins, and aggregates. Since most of Shared Buffers is used only once, the remaining pages are being supplied by the filesystem cache. The larger we make Shared Buffers, the smaller the filesystem cache becomes. Essentially Shared Buffers benefit frequently used pages; barring that, performance is likely to decrease.
It turns out that vast data warehouses work better with smaller allocations of Shared Buffers, because most pages will only be used once. The effort of keeping such pages in the buffer is apparently greater than letting the Operating System handle it.
Coming soon in Part 2
You know what they say: two out of three ain’t bad. These benchmarks seem to suggest that OLTP usage patterns work best with a reasonably sized active dataset that can fit fully in the Shared Buffer, and OLAP systems prefer the opposite. This is one of the reasons Postgres experts will say, “Well, it depends,” when it comes to making real recommendations for Shared Buffers.
And as it turns out, the picture became even more complicated when we expanded our tests to more modern hardware with greater amounts of RAM and improved storage. NVMe-based storage hardware is truly a disruptive technology in more ways than you might expect. We found ourselves both surprised and excited when we finally compiled the results.
Join us for Part 2 of this series, where we demonstrate how more available RAM and NVMe devices flip this entire discussion on its head!