How to Monitor PostgreSQL 12 Performance with OmniDB - Part 2

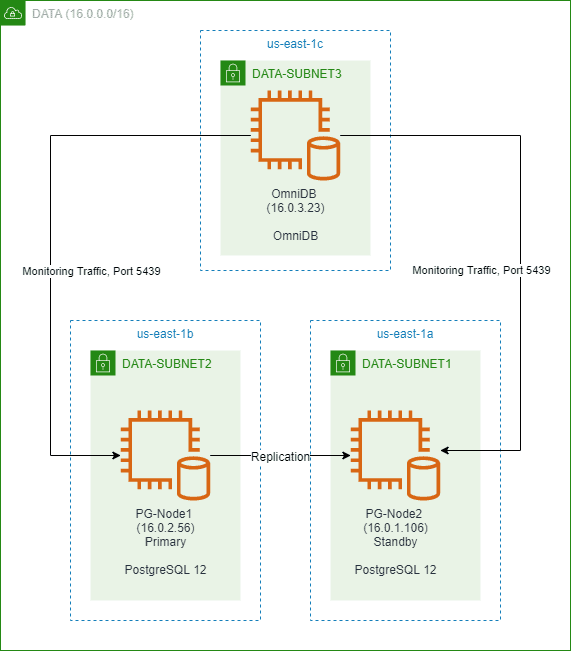
In a previous article of this series, we created a two-node PostgreSQL 12 cluster in the AWS cloud. We also installed and configured 2ndQuadrant OmniDB in a third node. The image below shows the architecture:
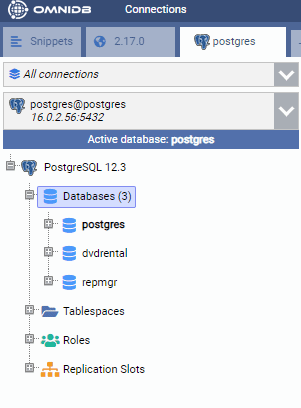
We could connect to both the primary and the standby node from OmniDB’s web-based user interface. We then restored a sample database called “dvdrental” in the primary node which started to replicate to the standby.
In this part of the series, we will learn how to create and use a monitoring dashboard in OmniDB. DBAs and operation teams often prefer graphical tools rather than complex queries to visually inspect database health. OmniDB comes with a number of important widgets that can be easily used in a monitoring dashboard. As we will see later, it also allows users to write their own monitoring widgets.
Building a Performance Monitoring Dashboard
Let’s start with the default dashboard OmniDB comes with.
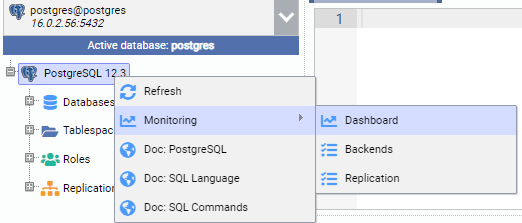
In the image below, we are connected to the primary node (PG-Node1). We right-click on the instance name, and then from the pop-up menu choose “Monitor” and then select “Dashboard”.
This opens a dashboard with some widgets in it.
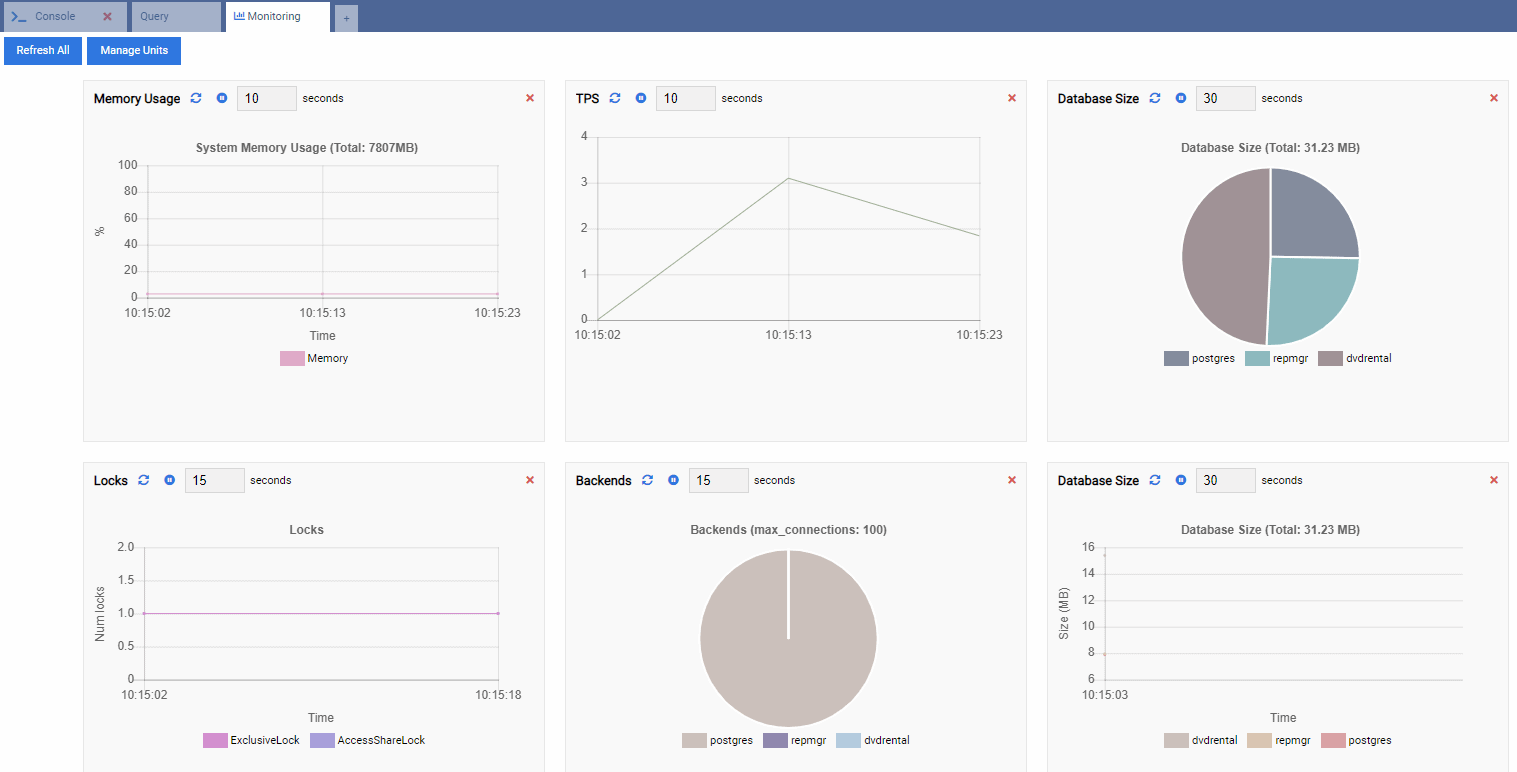
In OmniDB terms, the rectangular widgets in the dashboard are called Monitoring Units. Each of these units shows a specific metric from the PostgreSQL instance it’s connected to and dynamically refreshes its data.
Understanding Monitoring Units
OmniDB comes with four types of Monitoring Units:
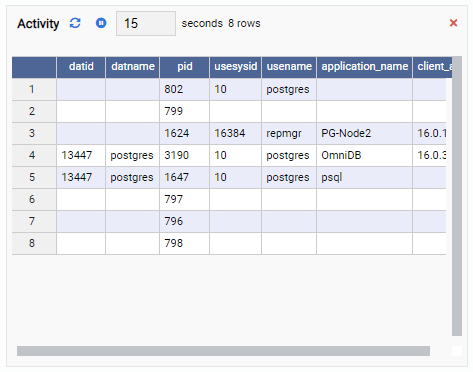
- A Grid is a tabular structure that shows the result of a query. For example, this can be the output of SELECT * FROM pg_stat_replication. A Grid looks like this:
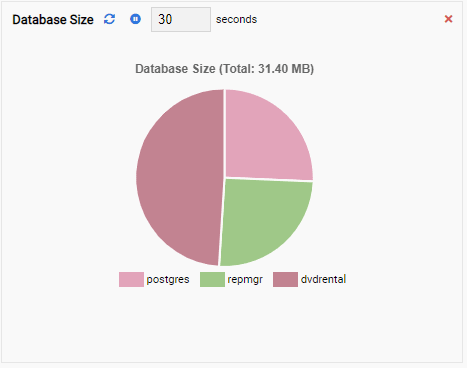
- A Chart shows the data in graphical format, like lines or pie charts. When it refreshes, the whole chart is redrawn on the screen with a new value, and the old value is gone. With these Monitoring Units, we can only see the current value of the metric. Here is an example of a Chart:
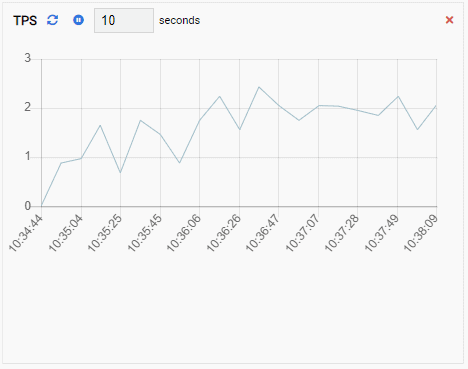
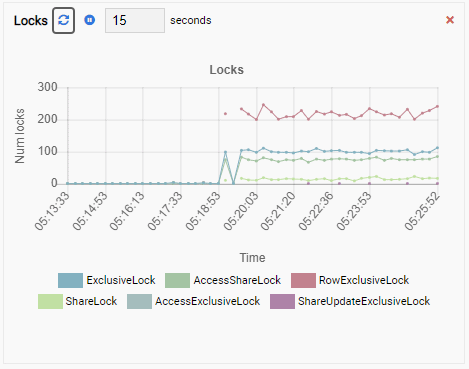
- A Chart-Append is also a Chart type Monitoring Unit, except when it refreshes, it appends the new value to the existing series. With Chart-Append, we can easily see trends over time. Here is an example:
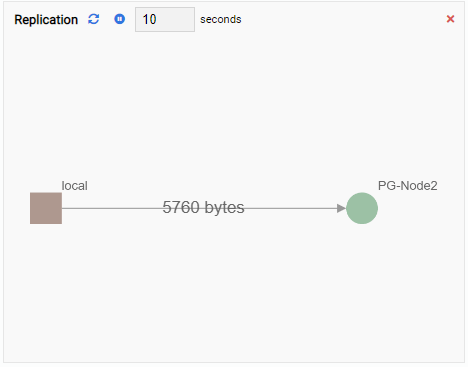
- A Graph shows relationships between PostgreSQL cluster instances and an associated metric. Like the Chart Monitoring Unit, a Graph Monitoring Unit also refreshes its old value with a new one. The image below shows the current node (PG-Node1) is replicating to the PG-Node2:
Every Monitoring Unit has a number of common elements:
- The Monitoring Unit name
- A “refresh” button to manually refresh the unit
- A “pause” button to temporarily stop the Monitoring Unit from refreshing
- A text box showing the current refresh interval. This can be changed
- A “close” button (red cross mark) to remove the Monitoring Unit from the dashboard
- The actual drawing area of the Monitoring
Pre-built Monitoring Units
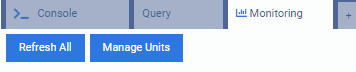
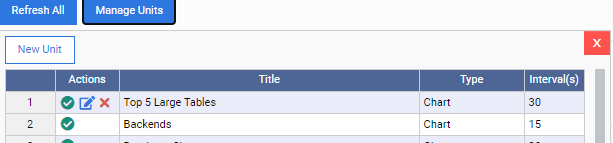
OmniDB comes with a number of Monitoring Units for PostgreSQL which we can add to our dashboard. To access these units, we click on the “Manage Units” button at the top of the dashboard:
This opens up the “Manage Units” list:
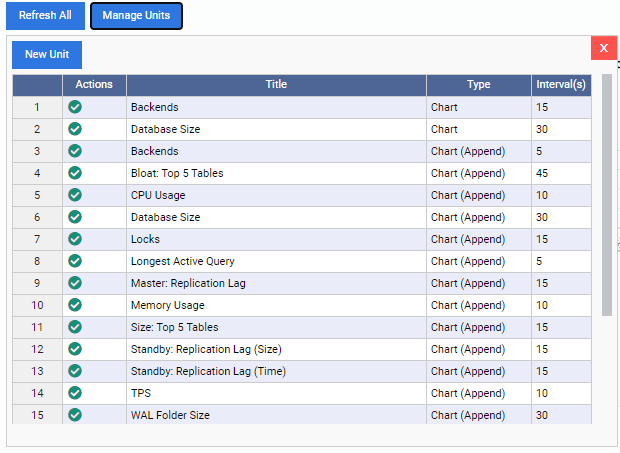
As we can see, there are few pre-built Monitoring Units here. The codes for these Monitoring Units are freely downloadable from 2ndQuadrant’s GitHub repo. Each unit listed here shows its name, type (Chart, Chart Append, Graph, or Grid), and the default refresh rate.
To add a Monitoring Unit to the dashboard, we just have to click on the green tick mark under the “Actions” column for that unit. We can mix and match different Monitoring Units to build the dashboard we want.
In the image below, we have added the following units for our performance monitoring dashboard and removed everything else:
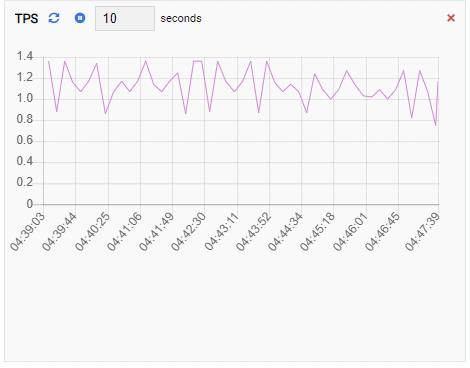
TPS (transaction per second):
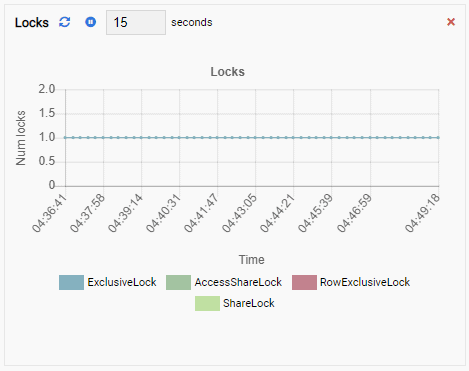
Number of Locks:
Number of Backends:
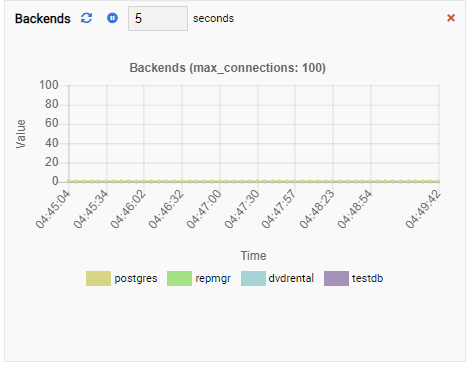
Since our instance is idle, we can see the TPS, Locks, and Backends values are minimal.
Testing the Monitoring Dashboard
We will now run pgbench in our primary node (PG-Node1). pgbench is a simple benchmarking tool that ships with PostgreSQL. Like most other tools of its kind, pgbench creates a sample OLTP systems’ schema and tables in a database when it initializes. After that, it can emulate multiple client connections, each running a number of transactions on the database. In this case, we won’t be benchmarking the PostgreSQL primary node; we will only create the database for pgbench and see if our dashboard Monitoring Units pick up the change in system health.
First, we are creating a database for pgbench in the primary node:
[postgres@PG-Node1 ~]$ psql -h PG-Node1 -U postgres -c "CREATE DATABASE testdb";
CREATE DATABASE
Next, we are initializing the “testdb” database for pgbench:
[postgres@PG-Node1 ~]$ /usr/pgsql-12/bin/pgbench -h PG-Node1 -p 5432  -I dtgvp -i -s 20 testdb
dropping old tables...
creating tables...
generating data...
100000 of 2000000 tuples (5%) done (elapsed 0.02 s, remaining 0.43 s)
200000 of 2000000 tuples (10%) done (elapsed 0.05 s, remaining 0.41 s)
…
…
2000000 of 2000000 tuples (100%) done (elapsed 1.84 s, remaining 0.00 s)
vacuuming...
creating primary keys...
done.
With the database initialized, we now start the actual load process. In the code snippet below, we are asking pgbench to start with 50 concurrent client connections against the testdb database, each connection running 100000 transactions on its tables. The load test will run across two threads.
[postgres@PG-Node1 ~]$ /usr/pgsql-12/bin/pgbench -h PG-Node1 -p 5432 -c 50 -j 2 -t 100000 testdb
starting vacuum...end.
…
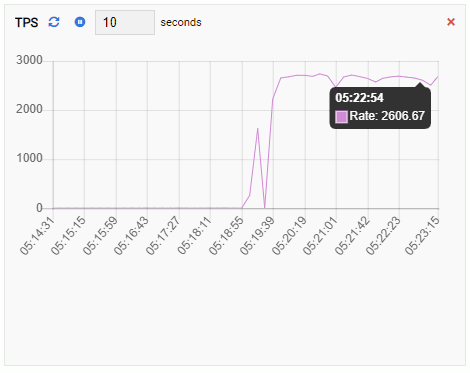
…If we now go back to our OmniDB dashboard, we see the Monitoring Units are showing some very different results.
The TPS metric is showing quite high value. There’s a sudden jump from less than 2 to more than 2000:
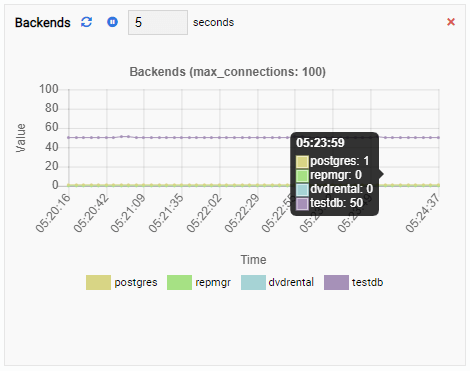
The number of backends has increased. As expected, testdb has 50 connections against it while other databases are idle:
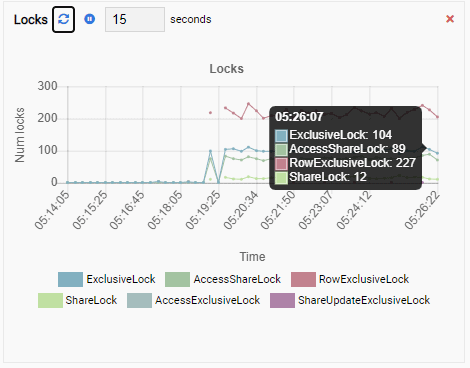
And finally, the number of row exclusive locks in the testdb database is high as well:
Now imagine this. You are a DBA and you use OmniDB for managing a fleet of PostgreSQL instances. You get a call to investigate slow performance in one of the instances.
Using a dashboard like the one we just saw (although it’s a very simple one), you can easily find the root cause. You can check the number of backends, locks, memory available, etc. to see what’s causing the issue.
And that’s where OmniDB can be a really helpful tool.
Creating Custom Monitoring Units
Sometimes we will need to create our own Monitoring Units. To write a new Monitoring Unit, we click the “New Unit” button in the “Manage Units” list. This opens a new tab with an empty canvas for writing code:
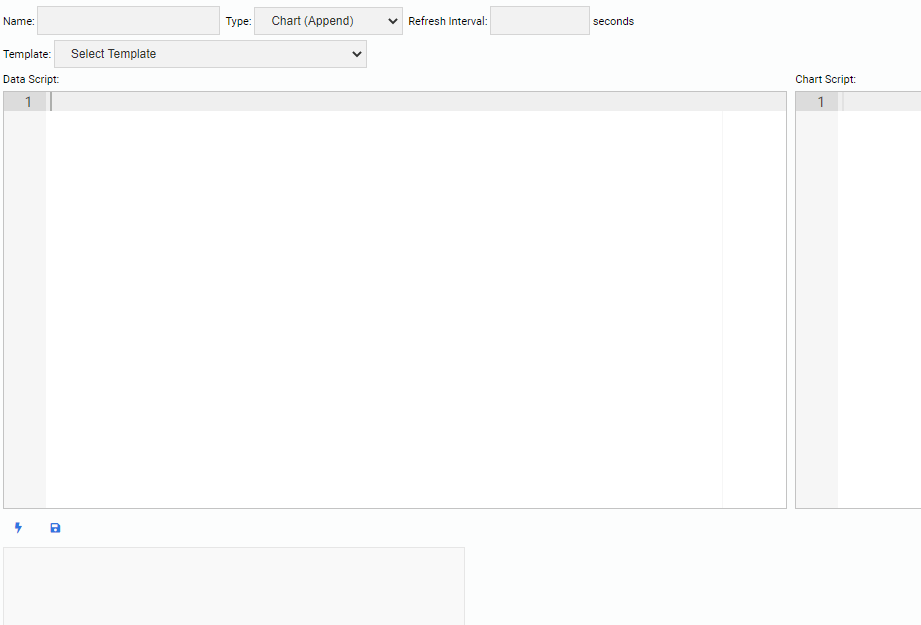
At the top of the screen, we have to specify a name for our Monitoring Unit, select its type, and specify its default refresh interval. We can also select an existing unit as a template.
Under the header section, there are two text boxes. The “Data Script” editor is where we write code to get data for our Monitoring Unit. Every time a unit is refreshed, the data script code will run. The “Chart Script” editor is where we write code for drawing the actual unit. This is run when the unit is drawn the first time.
All data script code is written in Python. For the Chart type Monitoring Unit, OmniDB needs the chart script to be written in Chart.js.
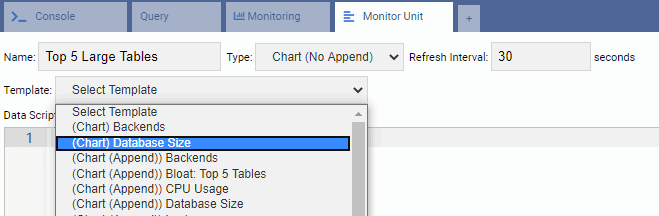
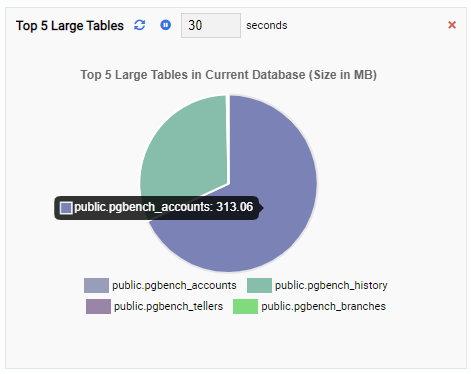
We will now create a Monitoring Unit to show the top 5 large tables in the current database. Based on the database selected in OmniDB, the Monitoring Unit will change its display to reflect the names of the five largest tables in that database.
For writing a new Unit, it’s best to start with an existing template and modify its code. This will save both time and effort. In the following image, we have named our Monitoring Unit “Top 5 Large Tables”. We have chosen it to be of Chart type (No Append) and provided a refresh rate of 30 seconds. We have also based our Monitoring Unit on the Database Size template:
The Data Script text box is automatically filled in with the code for Database Size Monitoring Unit:
from datetime import datetime
from random import randint

databases = connection.Query('''
    SELECT d.datname AS datname,
           round(pg_catalog.pg_database_size(d.datname)/1048576.0,2) AS size
    FROM pg_catalog.pg_database d
    WHERE d.datname not in ('template0','template1')
''')

data = []
color = []
label = []

for db in databases.Rows:
    data.append(db["size"])
    color.append("rgb(" + str(randint(125, 225)) + "," + str(randint(125, 225)) + "," + str(randint(125, 225)) + ")")
    label.append(db["datname"])

total_size = connection.ExecuteScalar('''
    SELECT round(sum(pg_catalog.pg_database_size(datname)/1048576.0),2)
    FROM pg_catalog.pg_database
    WHERE NOT datistemplate
''')

result = {
    "labels": label,
    "datasets": [
        {
            "data": data,
            "backgroundColor": color,
            "label": "Dataset 1"
        }
    ],
    "title": "Database Size (Total: " + str(total_size) + " MB)"
}
And the Chart Script text box is also populated with code:
total_size = connection.ExecuteScalar('''
    SELECT round(sum(pg_catalog.pg_database_size(datname)/1048576.0),2)
    FROM pg_catalog.pg_database
    WHERE NOT datistemplate
''')

result = {
    "type": "pie",
    "data": None,
    "options": {
        "responsive": True,
        "title":{
            "display":True,
            "text":"Database Size (Total: " + str(total_size) + " MB)"
        }
    }
}
We can modify the Data Script to get the top 5 large tables in the database. In the script below, we have kept most of the original code, except the SQL statement:
from datetime import datetime
from random import randint

tables = connection.Query('''
SELECT nspname || '.' || relname AS "tablename",
   round(pg_catalog.pg_total_relation_size(c.oid)/1048576.0,2) AS "table_size"
  FROM pg_class C
  LEFT JOIN pg_namespace N ON (N.oid = C.relnamespace)
  WHERE nspname NOT IN ('pg_catalog', 'information_schema')
    AND C.relkind <> 'i'
    AND nspname !~ '^pg_toast'
  ORDER BY 2 DESC
  LIMIT 5;
''')

data = []
color = []
label = []

for table in tables.Rows:
    data.append(table["table_size"])
    color.append("rgb(" + str(randint(125, 225)) + "," + str(randint(125, 225)) + "," + str(randint(125, 225)) + ")")
    label.append(table["tablename"])

result = {
    "labels": label,
    "datasets": [
        {
            "data": data,
            "backgroundColor": color,
            "label": "Top 5 Large Tables"
        }
    ]
}
Here, we are getting the combined size of each table and its indexes in the current database. We are sorting the results in descending order and selecting the top five rows.
Next, we are populating three Python arrays by iterating over the resultset.
Finally, we are building a JSON string based on the arrays’ values.
In the Chart Script text box, we have modified the code to remove the original SQL command. Here, we are specifying only the cosmetic aspect of the chart. We are defining the chart as pie type and providing a title for it:
result = {
"type": "pie",
"data": None,
"options": {
"responsive": True,
"title":{
"display":True,
"text":"Top 5 Large Tables in Current Database (Size in MB)"
}
}
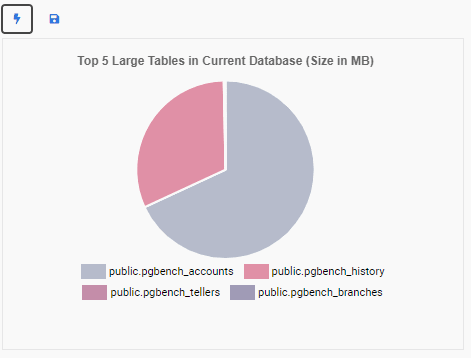
}Now we can test the unit by clicking on the lightning icon. This will show the new Monitoring Unit in the preview drawing area:
Next, we save the unit by clicking on the disk icon. A message box confirms the unit has been saved:

We now go back to our monitoring dashboard and add the new Monitoring Unit:
Notice how we have two more icons under the “Actions” column for our custom Monitoring Unit. One is for editing it, the other is for removing it from OmniDB.
The “Top 5 Large Tables” Monitoring Unit now displays the five largest tables in the current database:
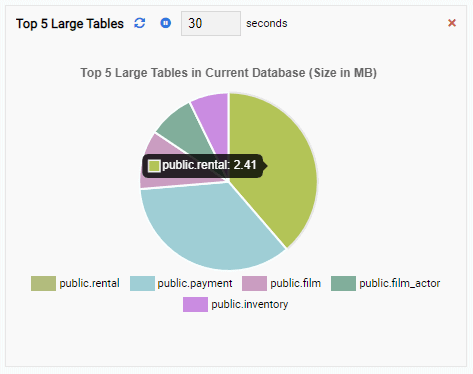
If we close the dashboard, switch to another database from the navigation pane, and open the dashboard again, we will see the Monitoring Unit has changed to reflect the tables of that database:
Final Words
This concludes our two-part series on OmniDB. As we saw, OmniDB has some nifty Monitoring Units that PostgreSQL DBAs will find useful for performance tracking. We saw how we can use these units to identify potential bottlenecks in the server. We also saw how to create our own custom units. Readers are encouraged to create and test performance Monitoring Units for their specific workloads. 2ndQuadrant welcomes any contribution to the OmniDB Monitoring Unit GitHub repo.