
Overview
pgAdmin 4 provides 2 different ways to execute queries on the database:
- Query tool:
You can write and execute custom queries on any table in the connected database.
- View/Edit data:
View/Edit data can be used to view or modify a particular table's data.
Query Tool
The Query Tool is a powerful, feature-rich environment that allows you to execute arbitrary SQL commands and review the result set. You can access the Query Tool via the Query Tool menu option on the browser tree tools menu or through the context menu of selected nodes of the browser tree control. You can open multiple copies of the Query tool in individual tabs simultaneously.
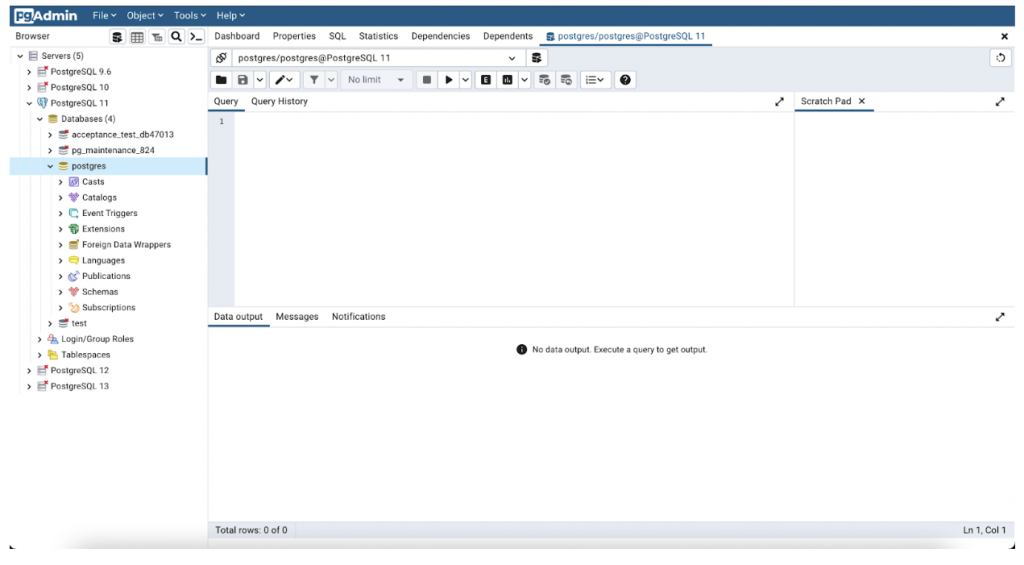
Query Editor
The Query editor panel is a workspace where you can manually provide a query, copy a query from another source, or read a query from a file. The Query editor features syntax coloring and autocompletion.
Let's try some examples for the Query Tool:
- Create Table:
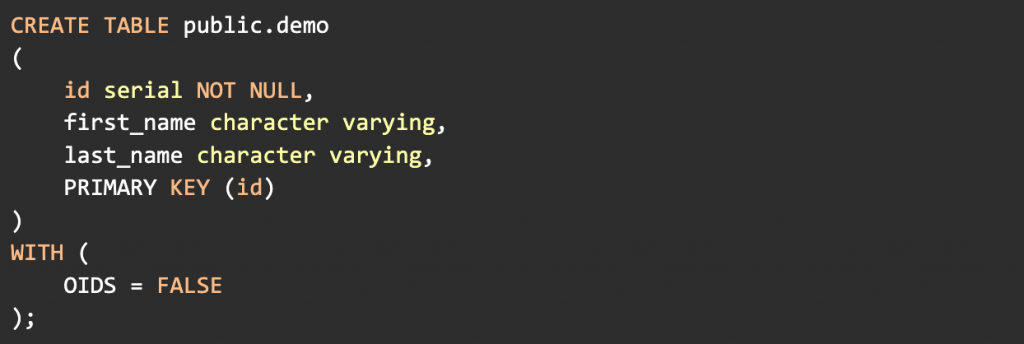
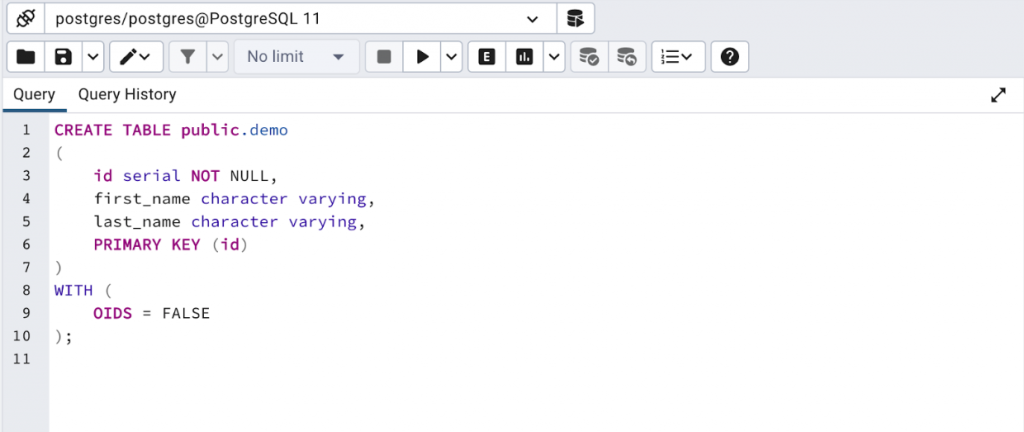
You can copy-paste the query in the query tool to create a new table. Similarly, you can create new database and database objects like Schemas, Functions, Materialized views, etc, using the query tool
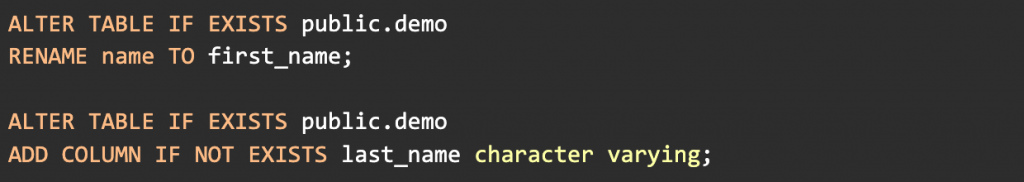
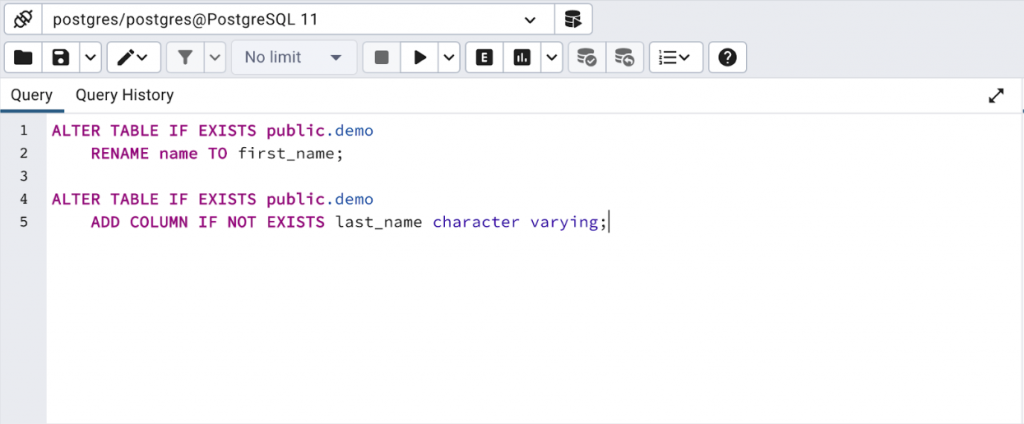
- Alter Table:
Alter the demo table, update the column name to first_name and add a new column last_name.
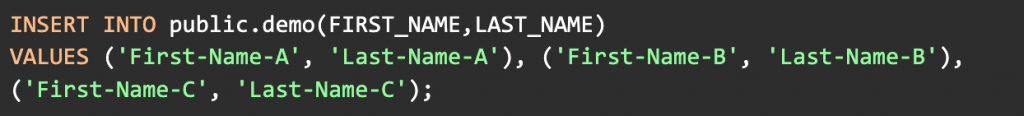
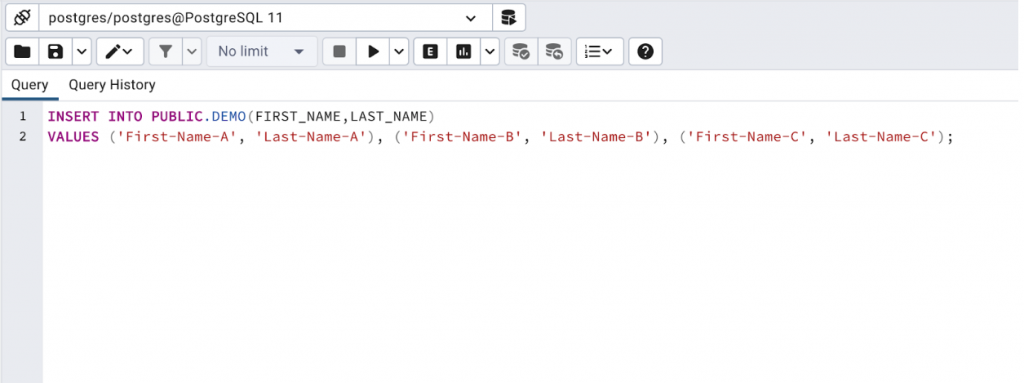
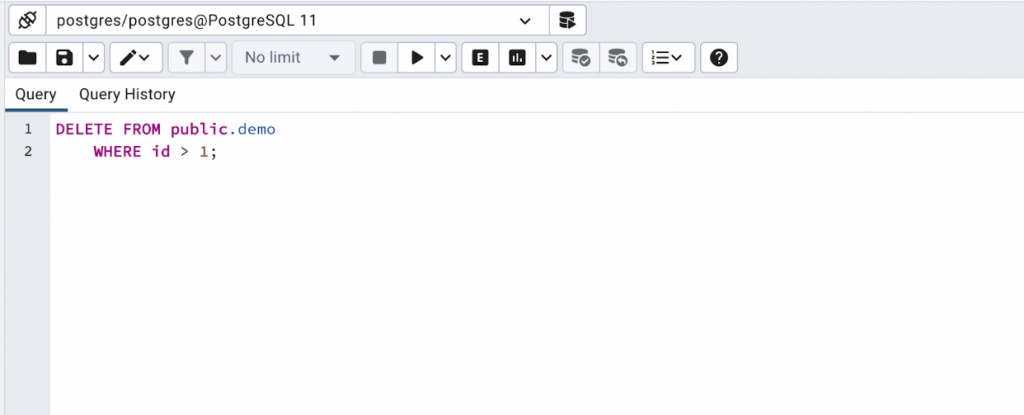
- Insert and Delete records:
Insert and Delete records from the same demo Table.

Fetch records
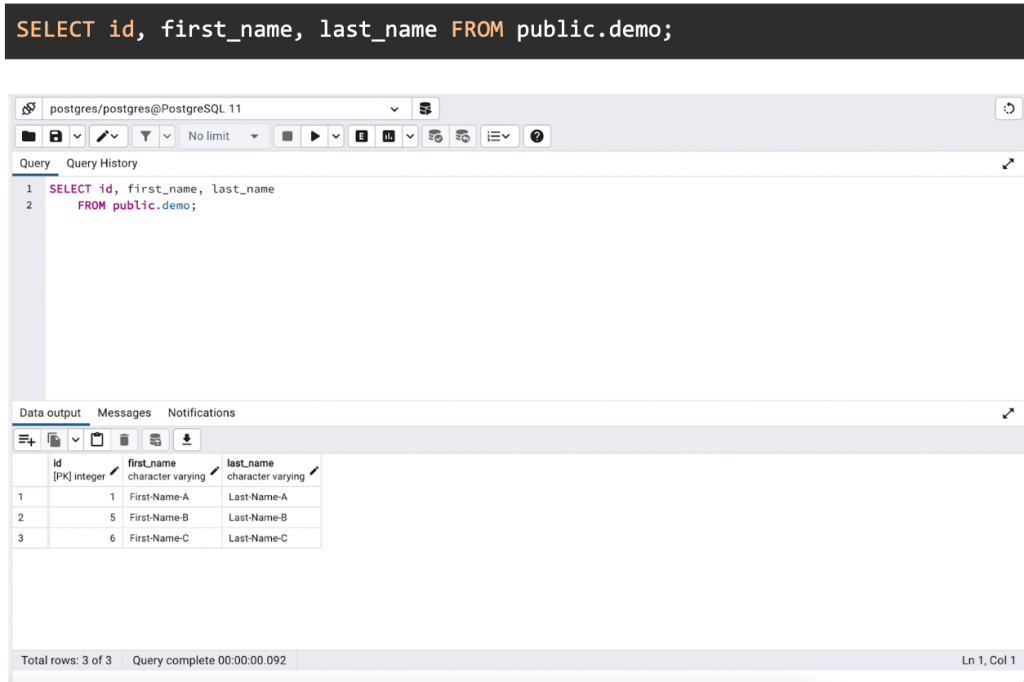
These are some basic queries you can execute in the query tool. You can run any custom query using the Query Tool.
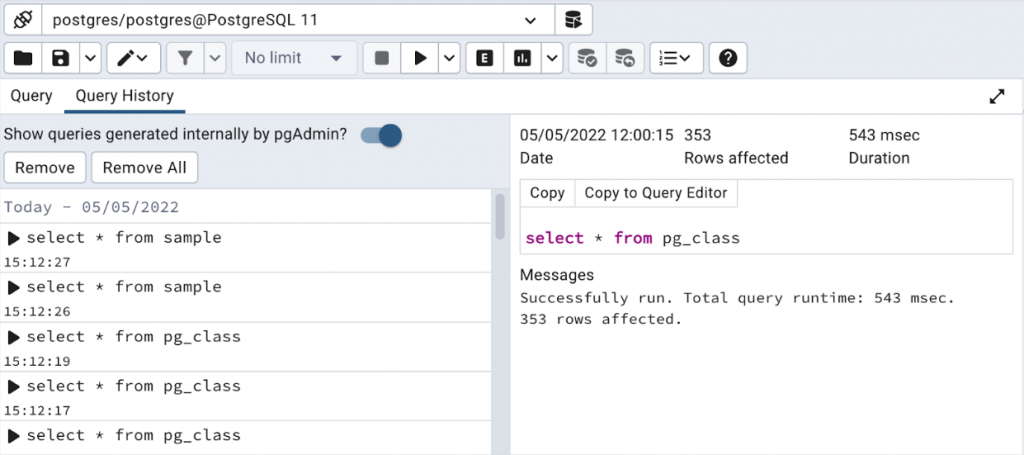
Query History
The Query History tab displays information about recent commands:
- The date and time that a query was invoked.
- The text of the query.
- The number of rows returned by the query.
- The amount of time it took the server to process the query and return a result set.
- Messages returned by the server (not noted on the Messages tab).
- The source of the query (indicated by icons corresponding to the toolbar).
You can show or hide the queries generated internally by pgAdmin by toggling the Show queries generated internally by pgAdmin? option. To erase the content of the Query History tab, select Remove or Remove All from the top of the query history panel.
Scratch Pad
This is used to hold text snippets during editing. You can close the scratch Pad by clicking the close button.
Toolbar:
The Query Tool toolbar uses context-sensitive icons that provide shortcuts to frequently performed tasks. If an icon is highlighted, the option is enabled; if the icon is grayed out, the task is disabled.
Tools available in Query tool:
- Open File
- Save File (You can select the Save As option from the dropdown)
- Edit: You will get different settings related to the Query Editor, e.g: Find, Replace, Format SQL, etc.
- Cancel Query
- Execute/Refresh: To execute the query which is written in the Query Editor.
- Explain and Explain Analyze
- Commit/Rollback: If Auto Commit is disabled, you can manually execute the Commit or Rollback by using these buttons
- Macros: This option enables you to execute predefined SQL queries with a single keypress. Use the Manage macros form drop-down to manage all macros.
Data output Panel
The Data Output panel displays data and statistics generated by the most recently executed query. It shows the result in table format and allows editing of the records in the table.
Note: To modify the content of a table, each row in the table must be uniquely identifiable. If the table definition does not include an OID or a primary key, the displayed data is read-only.
It also provides the following operations on the Data output table:
- Add row: Adds the new row in the table, you can enter the values in the row and save them in the table.
- Copy: Allows you to copy the selected Row(s) or cell(s), you can also copy the whole table with table headers just need to select the Copy with headers option from the dropdown which is present next to the Copy button. To select the whole table click on the top-left most cell in the table, you can also select the specific column by clicking on the column header.
- Paste: Allows you to paste the copied rows, It will add a new row on paste.
- Delete: Allows you to delete the selected row(s). It will mark the rows as deleted on the UI table, to save the changes on the server you need to click on the Save Data Changes button.
- Save Data Changes: Allows you to save the changes which you have made in the Data output panel.
- Save results to file: Aallows you to save the data displayed in the output panel to a CSV file and download it.
Explain Plan
To generate the Explain or Explain Analyze plan of a query, click on Explain or Explain Analyze button in the toolbar. More options related to Explain and Explain Analyze can be selected from the drop-down on the right side of Explain Analyze button in the toolbar.
Messages Panel
This panel shows the information about the most recently executed query. If the server returns an error, the error message will be displayed on the Messages tab.
Notifications Panel
Use the Notifications tab to view the notifications using the PostgreSQL Listen/Notify feature.
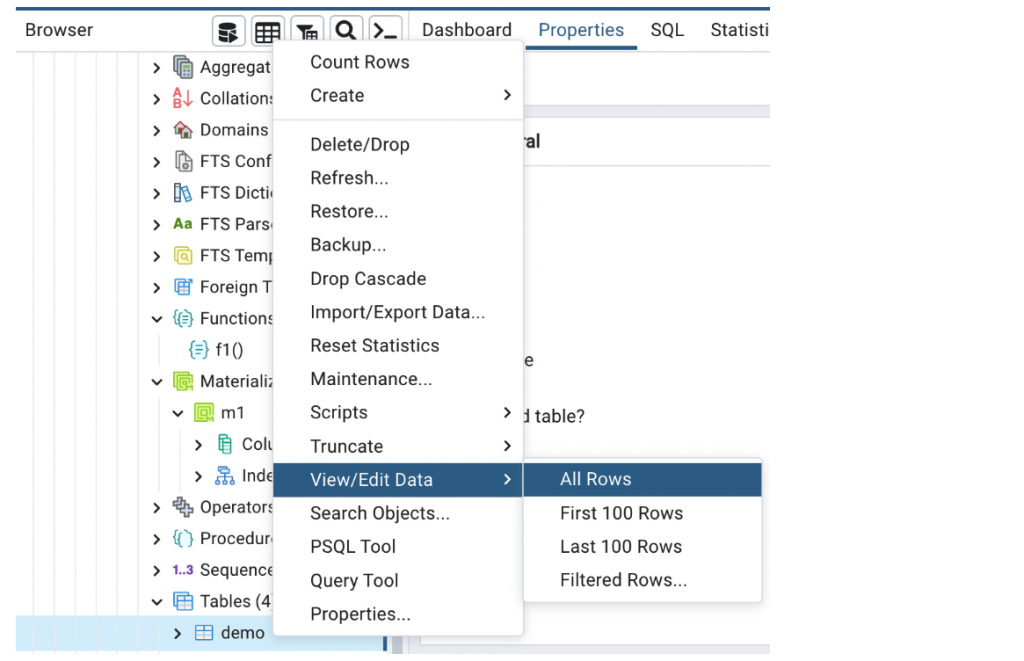
View/Edit Data
The View/Edit Data panel uses the same user interface as the Query Tool. It provides a quick way to view data from a table without writing queries. However, queries created view/edit can not be manually edited.
Options available in the View/Edit Data context menu:
- All Rows
- First 100 Rows: Fetches the first 100 rows.
- Last 100 Rows: Fetches the last 100 rows.
- Filtered Rows: You can specify any custom filter condition for fetching the data.
Although similar to the Query Tool in design, you can perform more filtering on table data using View/Edit Data.
Query Editor
In the View/Edit Data panel a query is generated by pgAdmin based on the inputs the user provided while opening the View/Edit Data panel for the table. You can’t edit the query in the Query Editor.
Example:
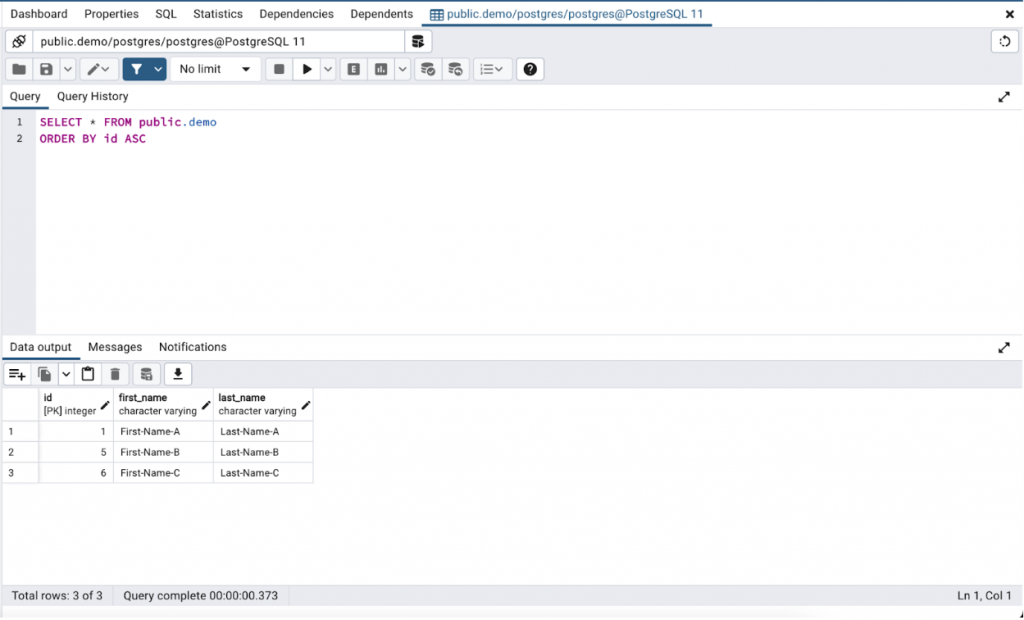
- Filter rows and change record order:
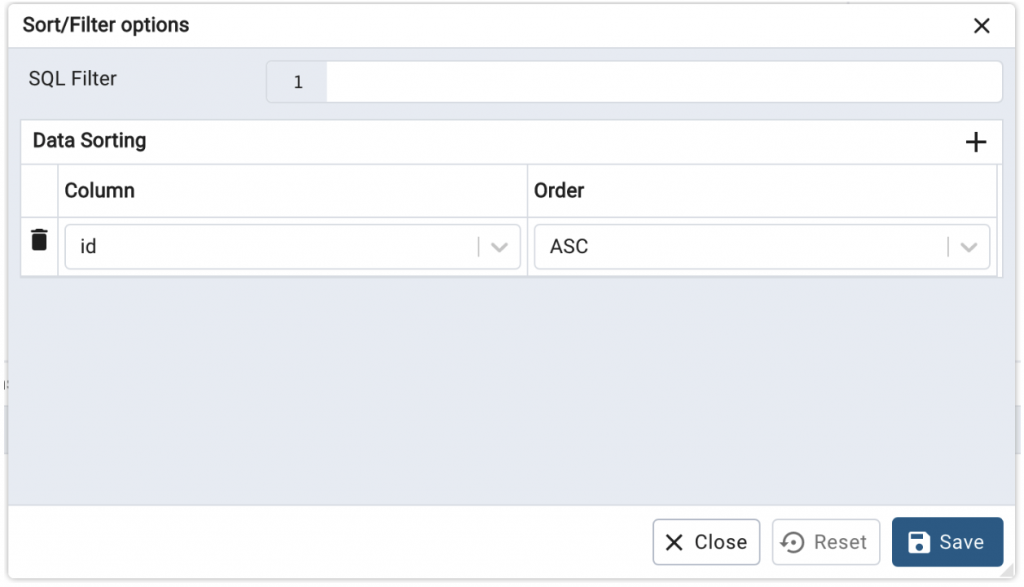
Click on the Sort/Filter button on the toolbar, It will open a dialog where you can add filter conditions and sort on the column(s).
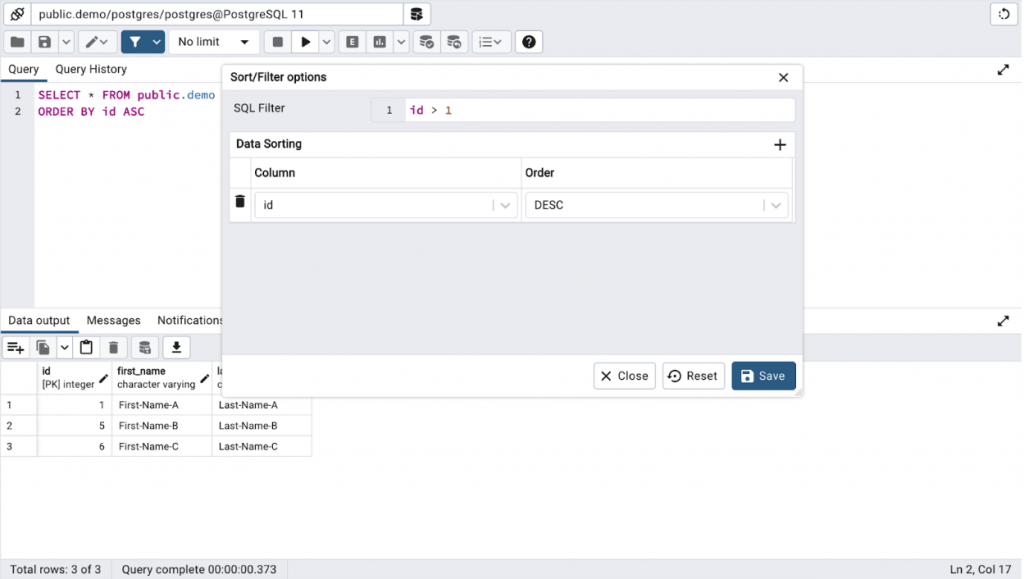
Once you click on the Save button, pgAdmin will update the query in Query Editor as per the filter and data sorting order selected by you.
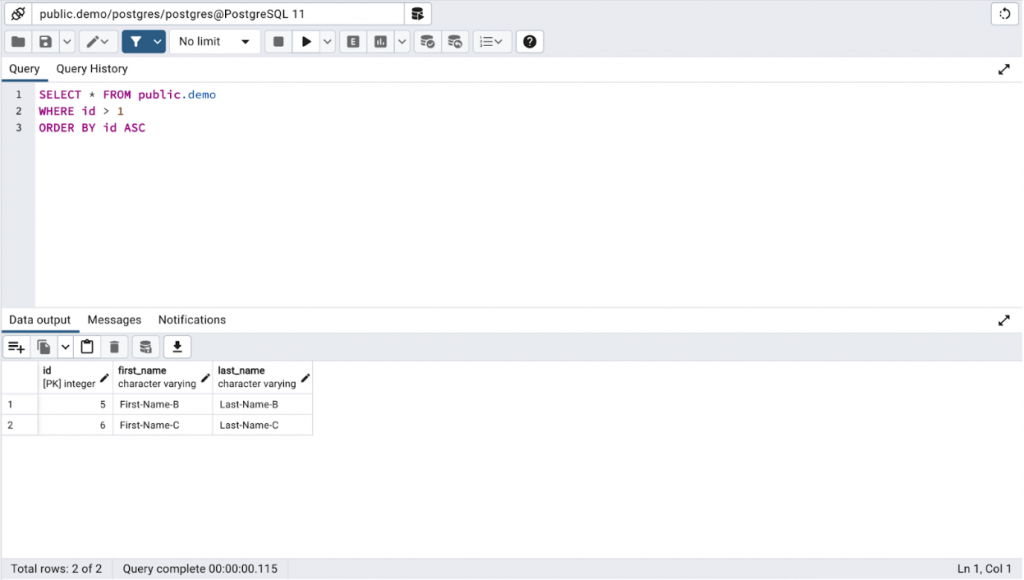
Here you can check that pgAdmin added the WHERE condition and updated the sorting order to ASC as per the user selections in the Sort/Filter dialog.
Query History
It provides the same functionality present in Query Tool, as discussed in the Query Tool section.
Toolbar
This toolbar is the same toolbar present in the Query Tool but there are a few features you can only use in the View/Edit Data.
Tools available in View/Edit Data:
- Sort/ Filter: You can add sorting or filtering to the query.
- Limit: You can set the limit to fetch the limited result for the query. No Limit option will fetch all the records.
- Cancel Query
- Execute/Refresh: To execute the query which is written by the Query Editor.
Note: Dropdown for Auto Commit and Auto Rollback is disabled for View/Edit Data.
Note: All other options in the toolbar will be disabled so the user can not use them in View/Edit Data.
View/Edit Data provides the same Data output, Messages, and Notifications panels with the same functionality we discussed earlier in the Query Tool section.
Conclusion
pgAdmin 4 provides two different ways to execute queries.
The Query Tool is mainly focused on giving the user the ability to write and execute custom queries. If you want to execute different queries like SELECT, INSERT, DELETE, etc you should use the Query Tool.
View/Edit Data is more focused on the single table interaction and performs the operations on that one table's data. If you want to fetch, update, or delete data from a particular table go with View/Edit Data.
Ref links:
https://www.pgadmin.org/docs/pgadmin4/latest/query_tool.html