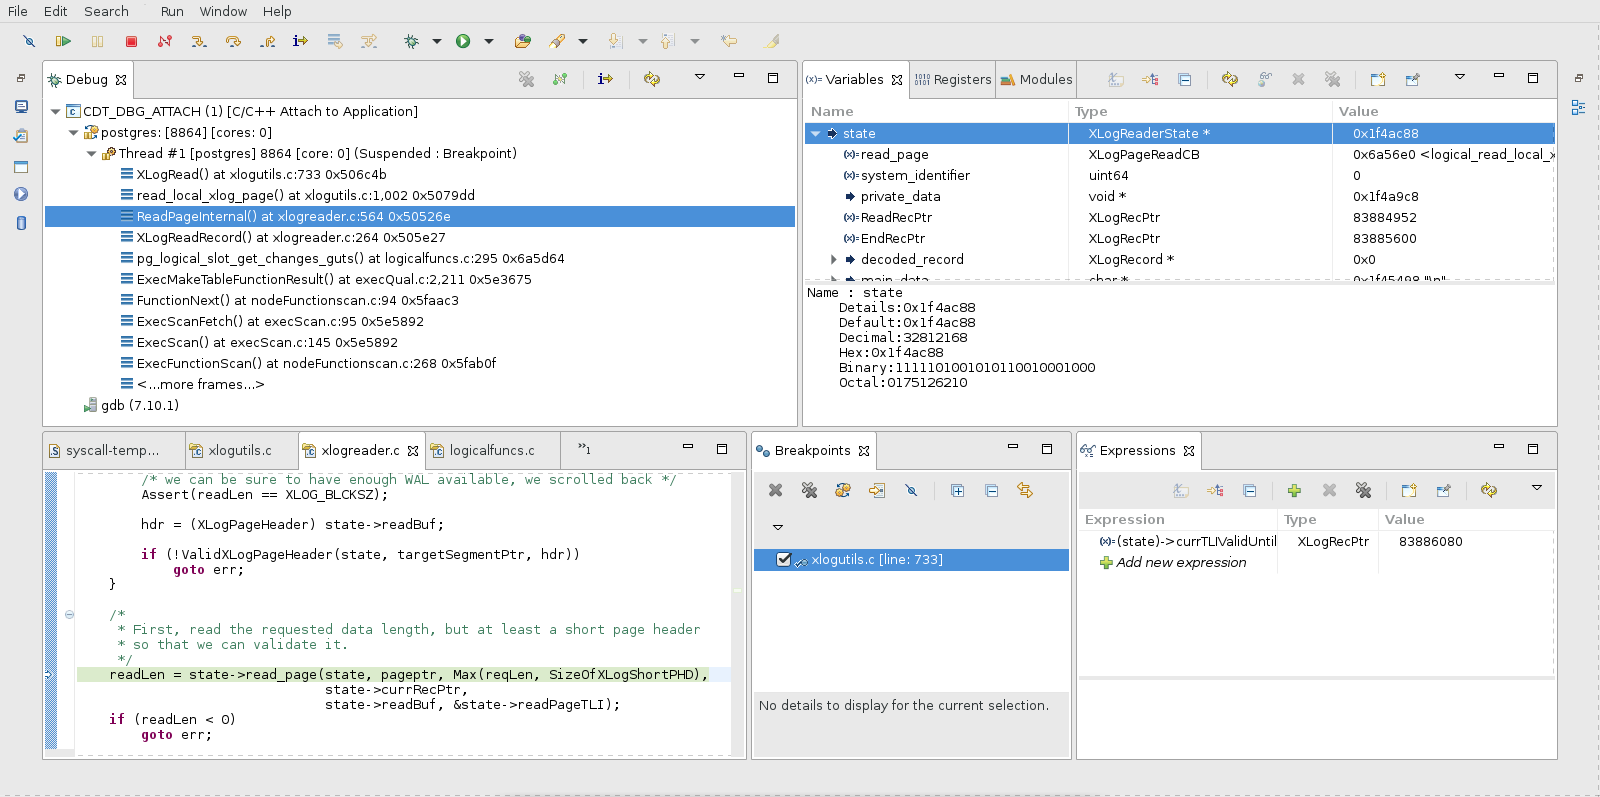
Visual PostgreSQL debugging
Having recently been doing some debugging work where many watchpoints, conditional breakpoints etc were necessary I’d like to shout out to a really useful tool: The standalone CDT debugger.
It’s part of the Eclipse project, but before you run screaming – it doesn’t require project setup or anything and it serves as a good GUI gdb wrapper. It’s good for working with PostgreSQL because you don’t need to set up a fake IDE project or any such time-wasting business. You just launch the debugger. You’ve still got your .gdbinit with postgresql debug helper macros and everything.
The CDT debugger still gives you access to the gdb console and all the features you’re used to, it just has a good UI for showing the values of locals, watched variables, stack browsing, setup of conditional breakpoints, etc.
Just:
dnf install eclipse-cdt
or
aptitude install eclipse-cdt
then get the backend pid of interest from ps or SELECT pg_backend_pid() and
cdtdebug -a $PID
It supports core files, debugging a program under direct control, and attaching.
The debugger does have a small startup time, unlike gdb, so it’s worth keeping open and detaching/re-attaching as needed when convenient. But it’s well worth it:
I’m looking into how to incorporate Tomas’s gdbpg or even better, extension support for displaying a List*‘s contents in the variable browse tree. Even without that it’s pretty handy.

