Continuing my monthly PostgreSQL benchmarks series, these latest findings are aimed at helping developers improve PostgreSQL performance stability. I discovered the performance stability issue when I had to reset the AWS instance I used for the Daily 500 benchmarks and lost 20% performance. The only explanation I have is that the reset instance physically moved in the data center. From an ongoing benchmarking perspective, this is unacceptable. I need to know if performance regressions are due to code changes or not so the environment must stay as stable as possible.
Testing
In order to better control the environment, EDB has purchased a dedicated server that we self host. To help us to understand the I/O performance of the storage system, we ran a number of tests using fio. The reason for this was to ensure that we were making the best of the hardware as there were some concerns raised within the EDB team about how the NVMe drives would perform and if the use of Linux software RAID (mdraid) would have any noticeable effect on CPU results. We used a 2TB test to ensure the data was much larger than the available RAM on the system for all but the one drive test where there wasn't enough space. The fio configuration is as follows:
[root@chaos ~]# cat read-write.fio
[read-write]
rw=rw
rwmixread=75
# 18g for 2+ drives
size=13g
directory=/nvme
fadvise_hint=0
blocksize=8k
direct=0
# 1 job per available CPU thread
numjobs=112
nrfiles=1
runtime=1h
time_based
exec_prerun=echo 3 > /proc/sys/vm/drop_caches
The results are shown below:
| Read/write ratio | Drive config | # | Drive size | Size/ core (MiB) | Total size (GiB) | Read IOPs | Write IOPs | Total IOPs | Read BW (MB/s) | Write BW (MB/s) | Total BW |
|---|---|---|---|---|---|---|---|---|---|---|---|
| 75/25 | 1 x NVMe | 1 | 1.5 TB | 13312 | 1456 | 305,766 | 101,877 | 407,643 | 2505 | 835 | 3340 |
| 75/25 | 2 x NVMe, RAID 0 | 2 | 3.0 TB | 18432 | 2016 | 614,783 | 204,890 | 819,673 | 5037 | 1679 | 6716 |
| 75/25 | 4 x NVMe, RAID 0 | 4 | 6.0 TB | 18432 | 2016 | 1,238,221 | 403,096 | 1,641,317 | 9907 | 3303 | 13210 |
| 75/25 | 6 x NVMe, RAID 0 | 6 | 9.0 TB | 18432 | 2016 | 1,609,626 | 527,612 | 2,137,238 | 12288 | 4122 | 16410 |
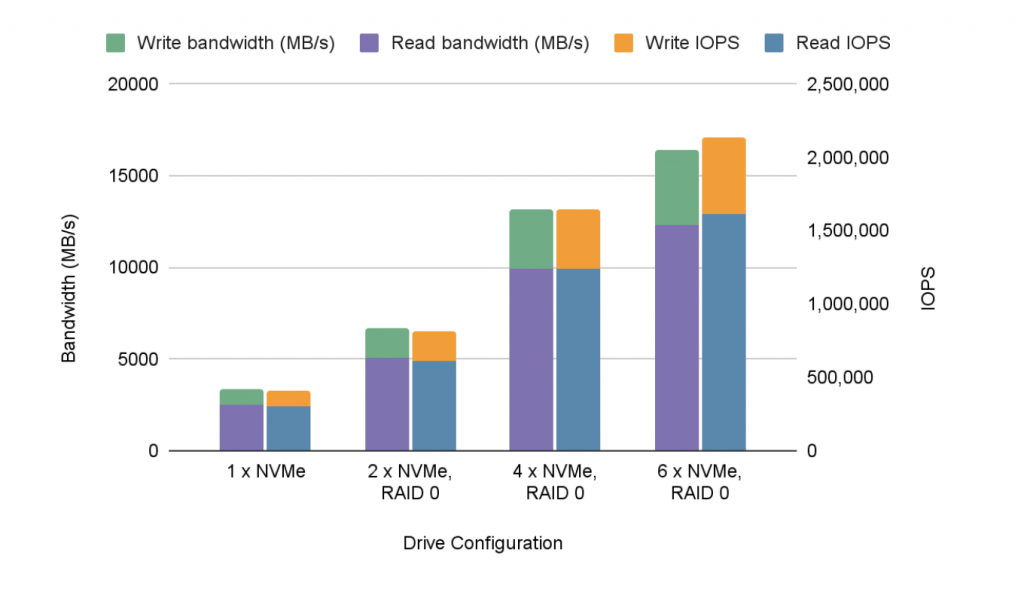
Or in graphic form:

These drives basically scale linearly which is quite reassuring. Our belief is that it might continue to scale almost linearly until such time as the number of PCI lanes used by the drives (they're x4 drives, so four lanes each) approaches the number of lanes in the system (48 for each of the two Xeon Gold 6258R CPUs). Of course, we only have six drives in there so cannot validate that theory.
Note that these tests were performed using RAID 0 (striped). It's quite possible that Linux mdraid will use more (or fewer) CPU resources with different RAID levels. RAID 0 is appropriate here because we're trying to maximize the possibility for parallel read/writes across devices as this machine is intended for running benchmarks for regression testing and not storage of valuable production data.
Results
The full specification of the machine is as follows:
PowerEdge R740XD Server
- 2 x Intel Xeon Gold 6258R 2.7G, 28C/56T, 10.4GT/s, 38.5M Cache
- 16 x 64GB RDIMM, 3200MT/s, Dual Rank (1TB total)
- 4 x 800GB SSD SAS Mix Use 12Gbps 512e 2.5in Hot-plug AG Drive
- 6 x Dell 1.6TB, NVMe, Mixed Use Express Flash, 2.5 SFF Drive
- 1 x Broadcom 57412 Dual Port 10GbE SFP+ & 5720 Dual Port 1GbE BASE-T rNDC
If you're working on improving performance stability, these findings should help simplify the process. Stay tuned for next month, when I will show a comparison between PG 13.3 and PG 14beta1 using this machine.
